E Effects of specific mispronunciations in Study 2
In this section, I briefly discuss item-level differences for the mispronunciation task.
I intended to formally analyze and model these effects as part of the main analysis. Prior to beginning this project, I expected that children would show different responses for different real-word–mispronunciation pairs. Not all mispronunciations are equally bad, and in fact, there could be some systematic tendencies in the badness of the mispronunciations. I hypothesized that children would show less of a penalty for later-acquired sounds. What I had in mind in particular was that rice and wice would be more similar than, say, duck and guck and other pairs.
The design of this experiment and the data collected, however, are not equipped to address this hypothesis. I came to this conclusion after visualizing the rice versus wice looking data and observing that children looked to rice less than the other real words. Figure E.1 shows the growth curves for real word and mispronunciations.
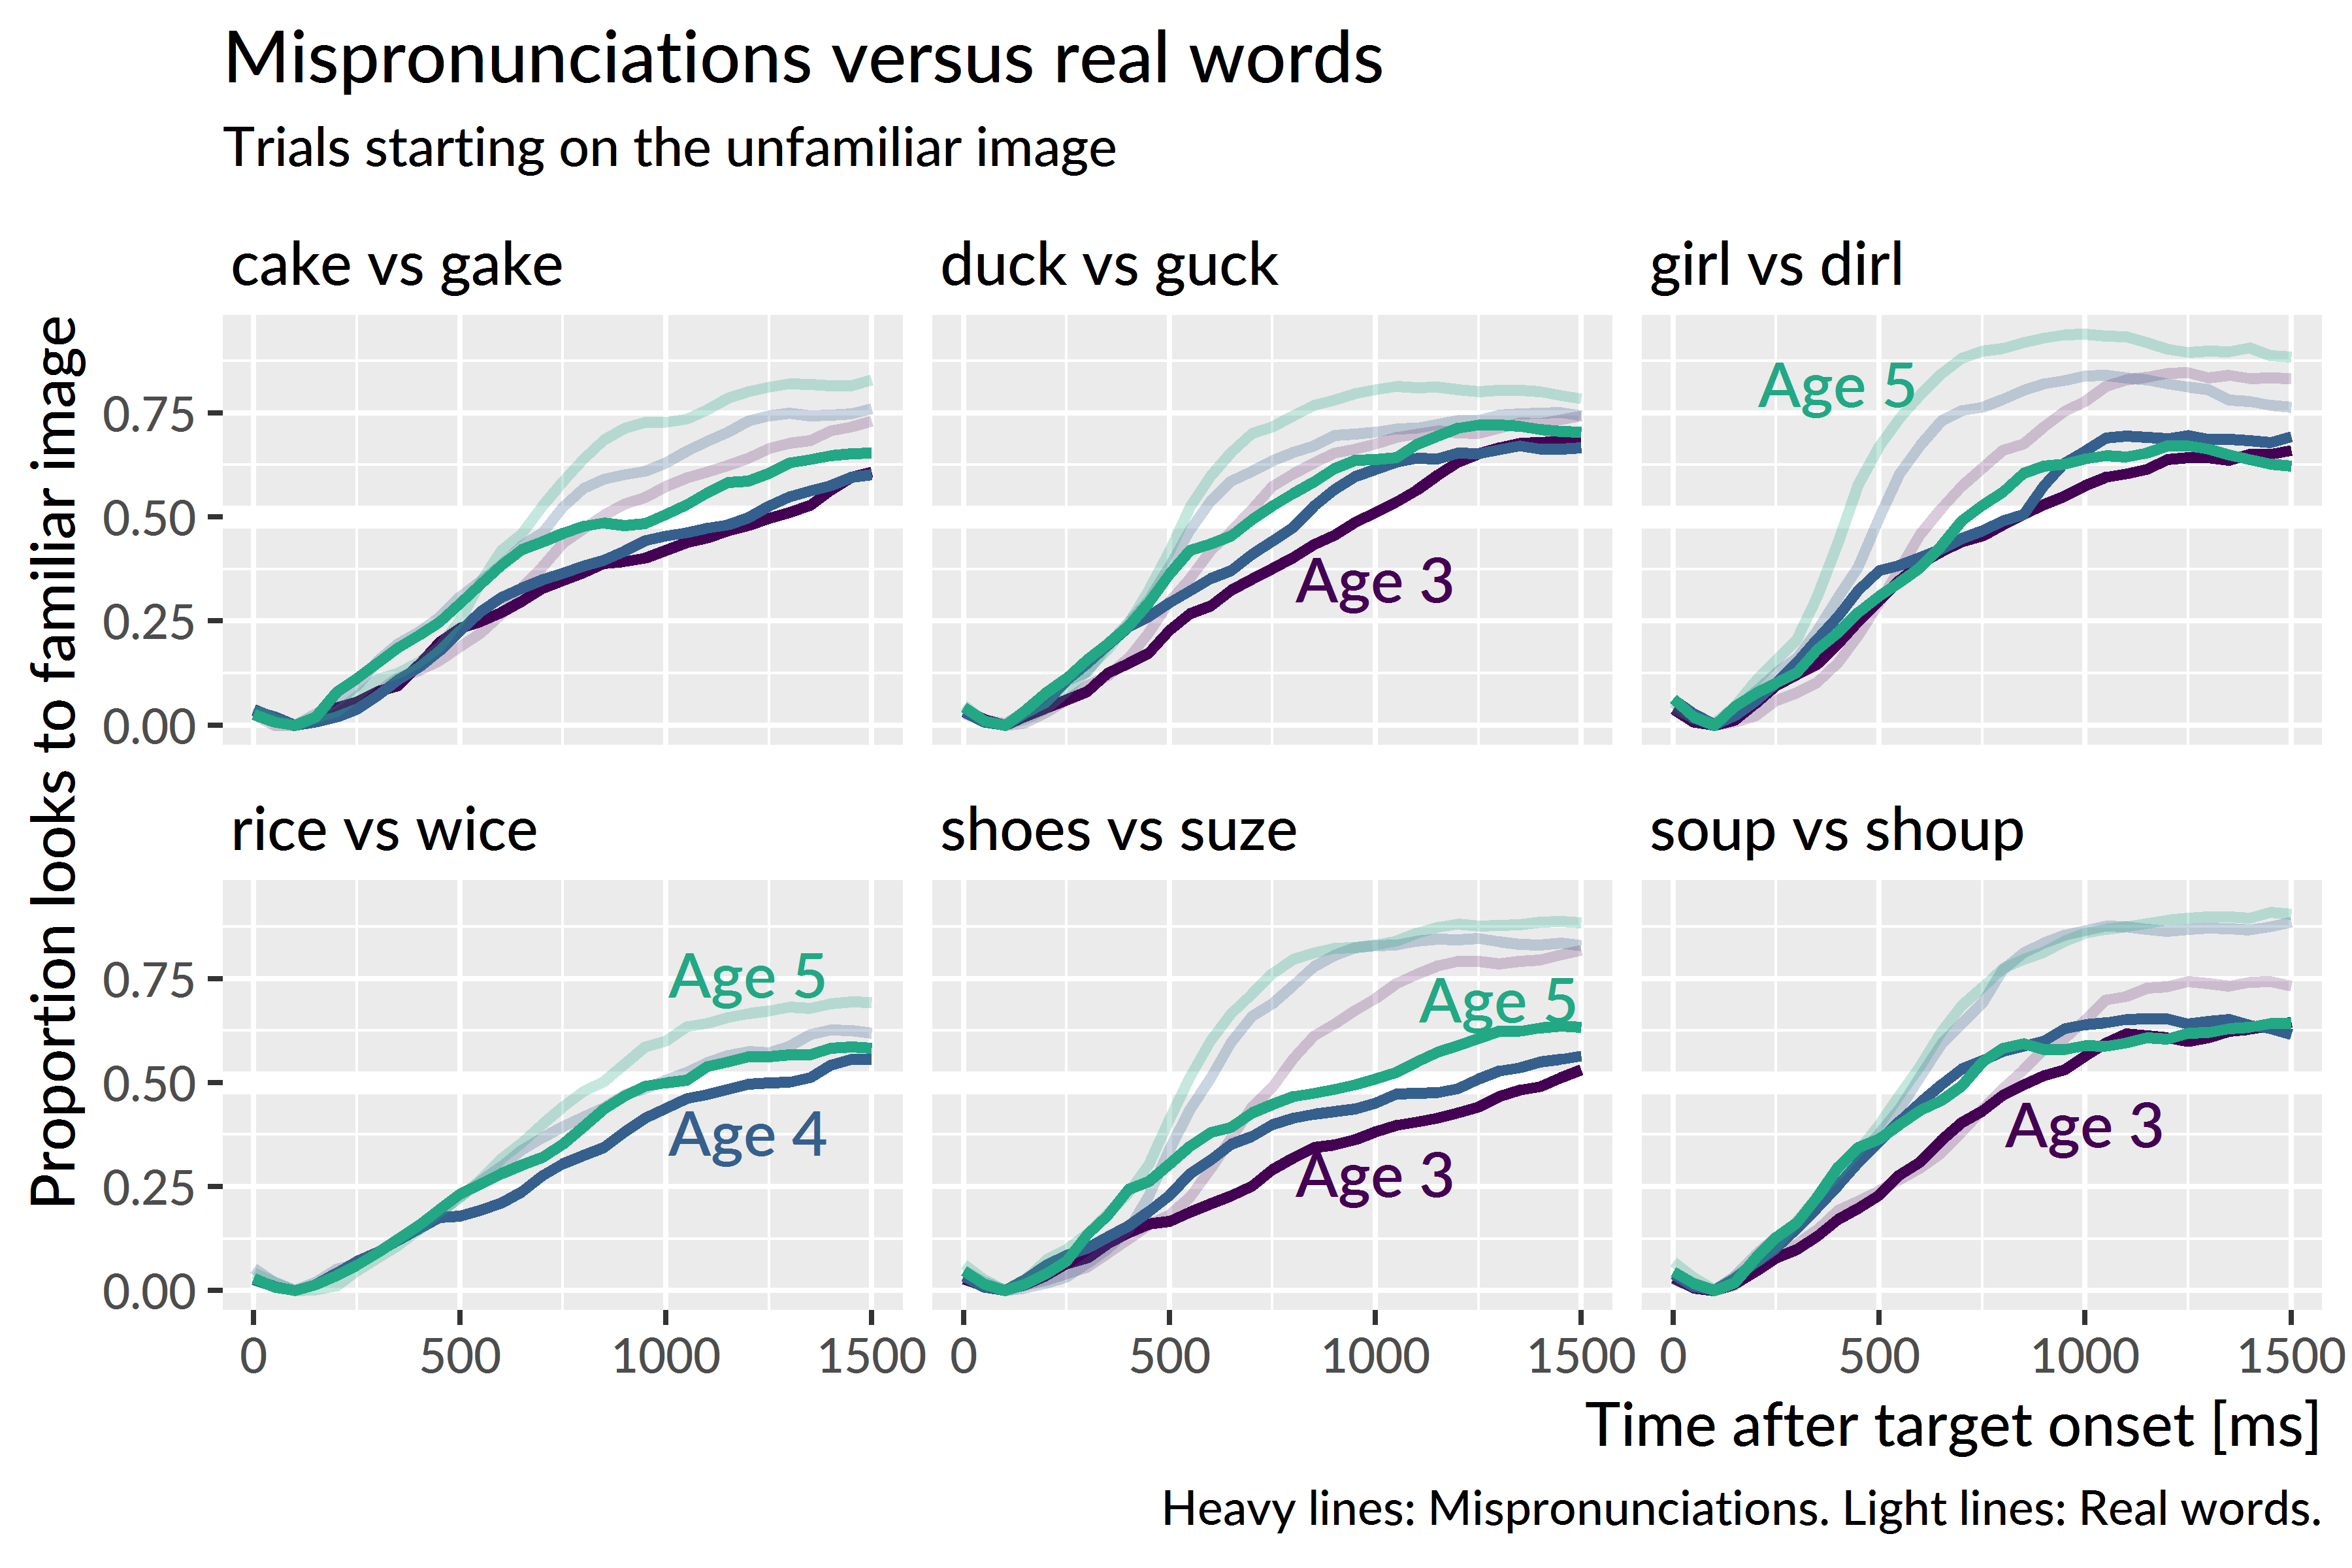
Figure E.1: Average proportion of looks to the familiar object for real words and mispronunciations. A dog–tog pair was administered at age 3 but it was replaced by rice–wice at age 4.
Rice and wice are indeed very similar, but children do not know rice very well it seems. In the plot, for instance, age-5 rice has as many looks as age-4 dirl. Given that the data tested only 6 mispronunciations per year, compounded by the fact that some real words are harder than others, I decided that it would not feasible to draw conclusions about different kinds of mispronunciations. A more appropriate study would test many more mispronunciations and vary the familiarity of the paired real words to handle these limitations.
It is still informative to plot the differences between the real word and mispronunciation lines, as in Figure E.2. This plot confirms that rice and wice are very similar. One interesting, and somewhat unexpected feature, is how the differences increase with age for some items. Namely, it appears that dirl becomes a worse and worse realization of girl as children grow older. A similar change happens with shoup for soup.
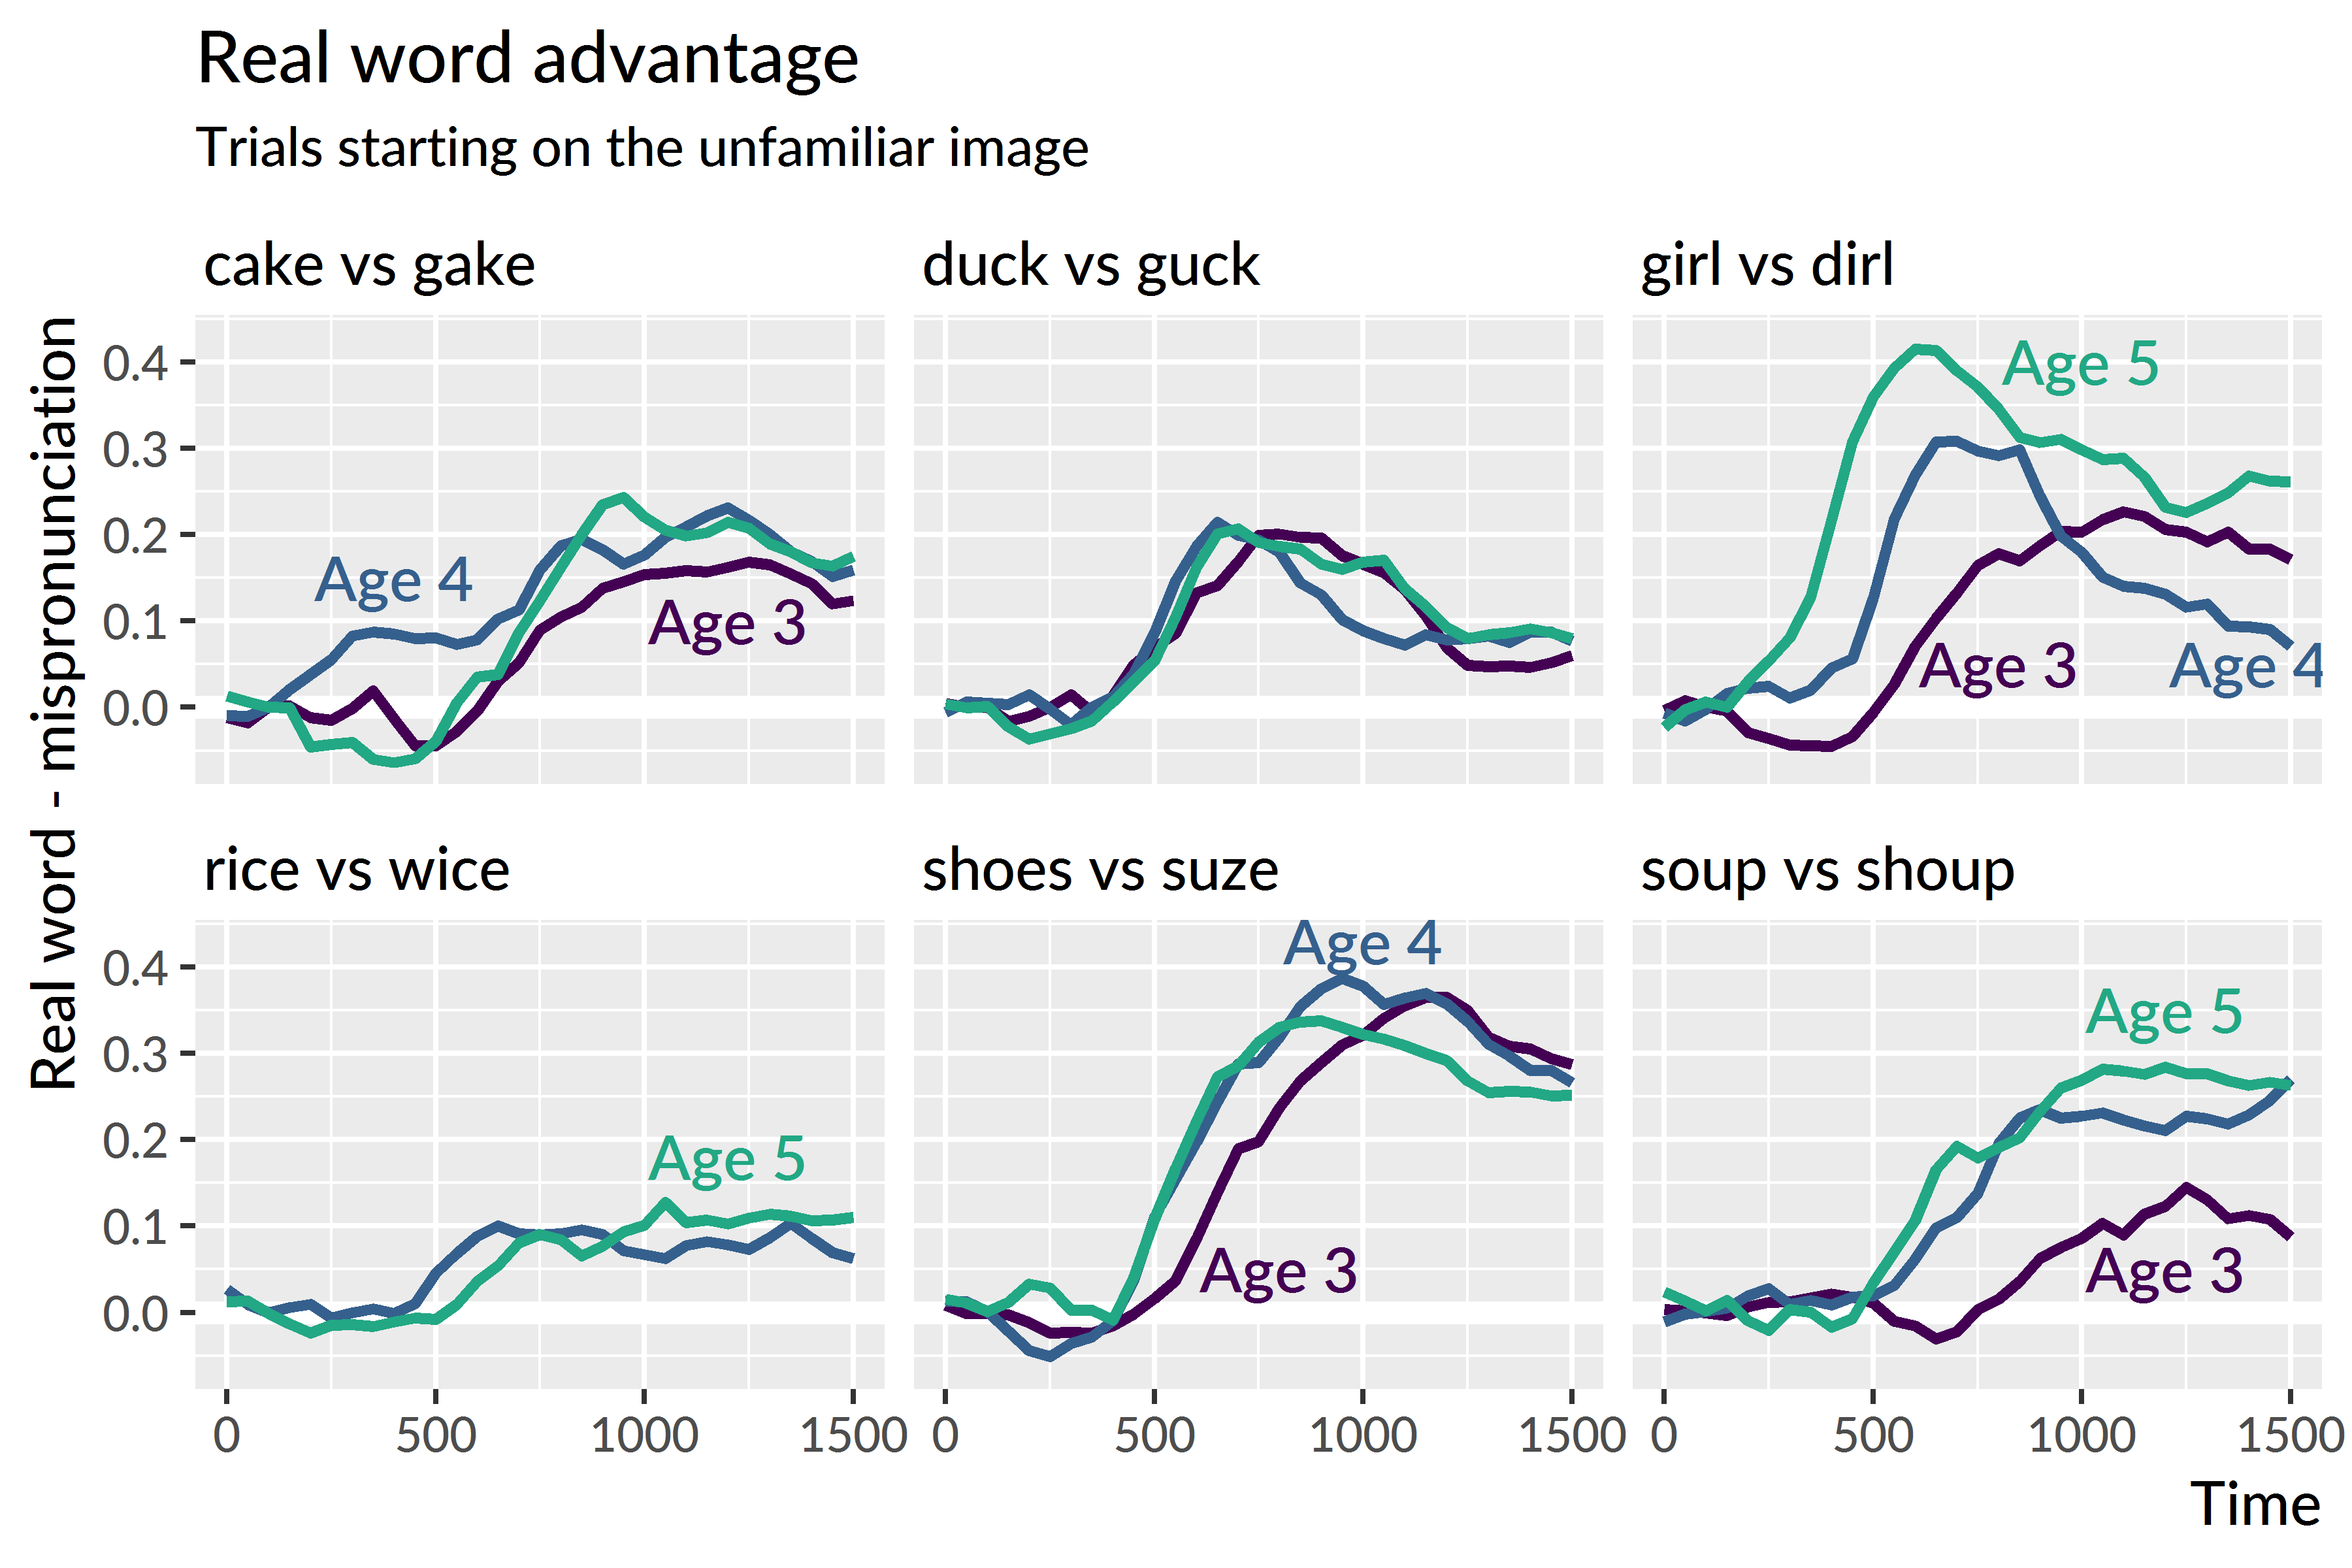
Figure E.2: Differences between the average proportion of looks to real words and mispronunciations.