Deleting or blanking a facet cell in ggplot2
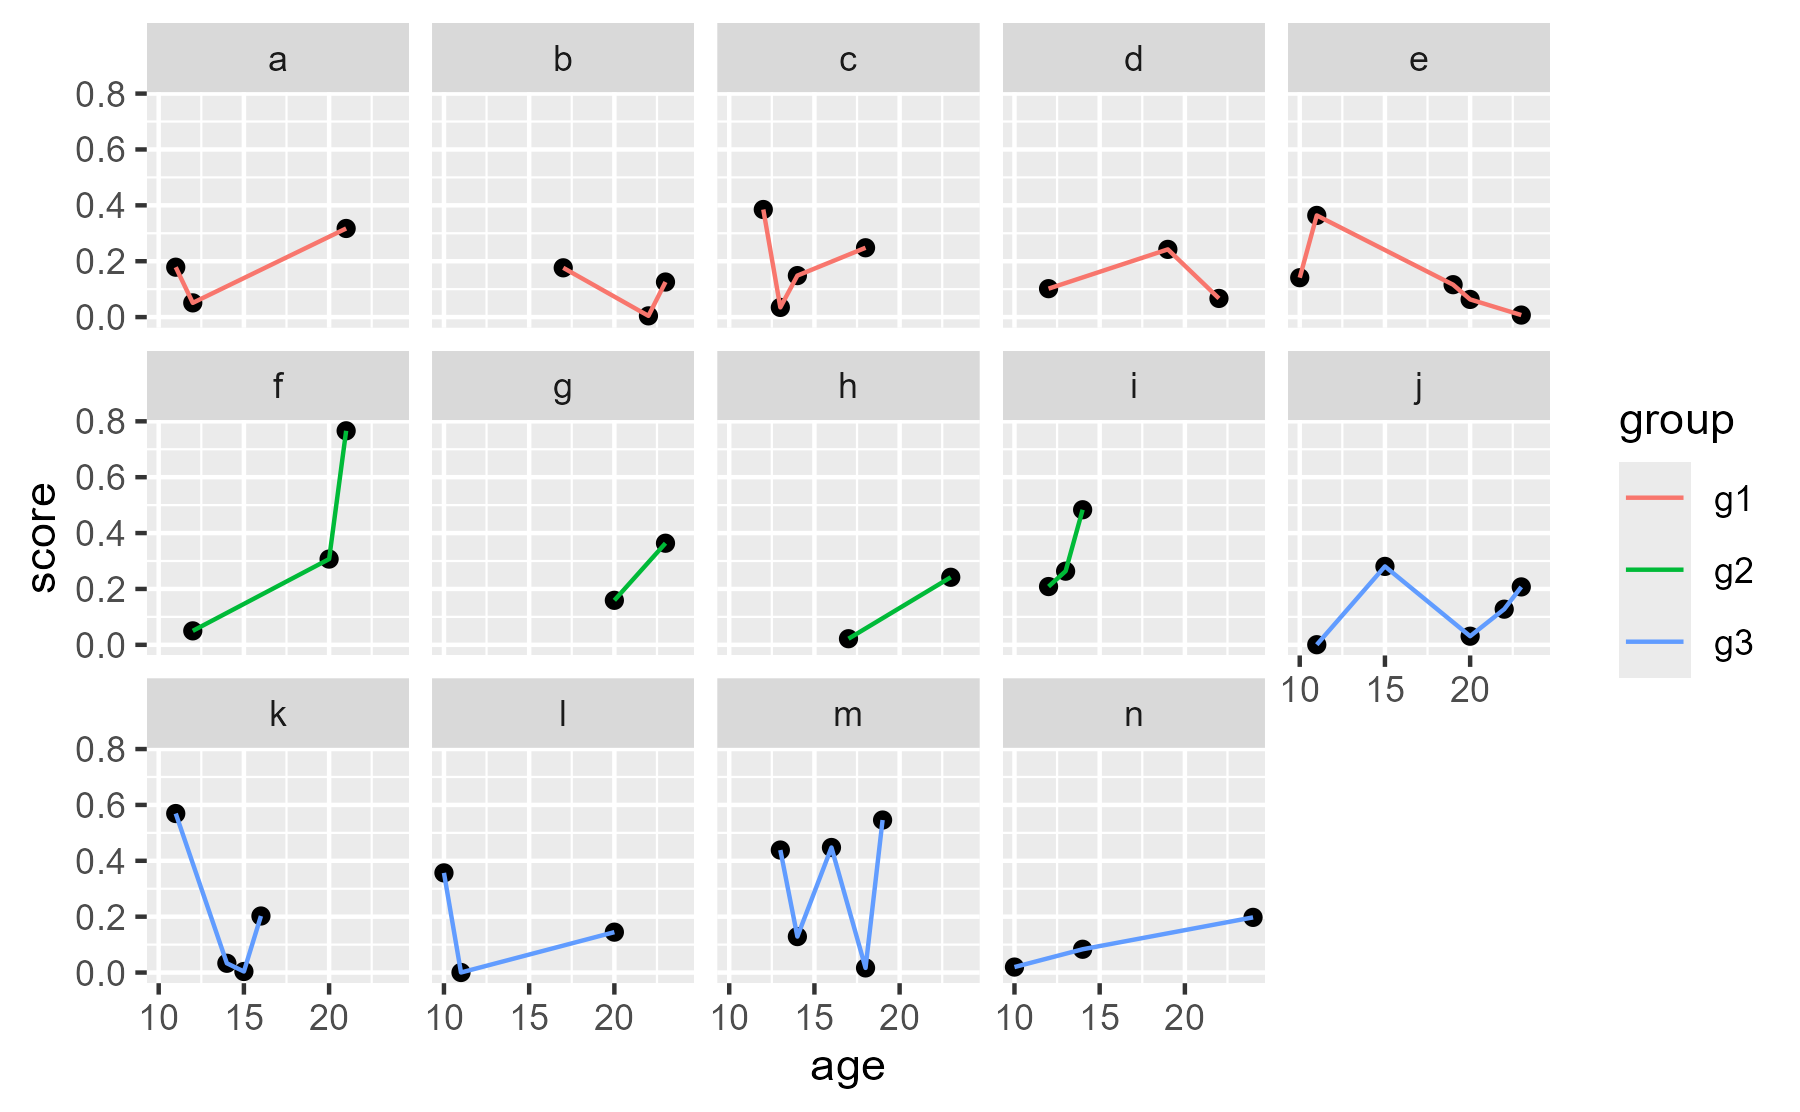
Suppose you have some ragged data.
set.seed(20220121)
library(tidyverse)
#> Warning: package 'tibble' was built under R version 4.5.2
#> Warning: package 'tidyr' was built under R version 4.5.2
#> Warning: package 'readr' was built under R version 4.5.2
#> Warning: package 'purrr' was built under R version 4.5.2
#> Warning: package 'dplyr' was built under R version 4.5.2
#> Warning: package 'stringr' was built under R version 4.5.2
#> Warning: package 'lubridate' was built under R version 4.5.2
#> ── Attaching core tidyverse packages ──────────────────────── tidyverse 2.0.0 ──
#> ✔ dplyr     1.2.0     ✔ readr     2.2.0
#> ✔ forcats   1.0.1     ✔ stringr   1.6.0
#> ✔ ggplot2   4.0.2     ✔ tibble    3.3.1
#> ✔ lubridate 1.9.5     ✔ tidyr     1.3.2
#> ✔ purrr     1.2.1
#> ── Conflicts ────────────────────────────────────────── tidyverse_conflicts() ──
#> ✖ dplyr::filter() masks stats::filter()
#> ✖ dplyr::lag()    masks stats::lag()
#> ℹ Use the conflicted package (<http://conflicted.r-lib.org/>) to force all conflicts to become errors
data <- tibble(
  id = letters[1:14],
  group = rep(c("g1", "g2", "g3"), times = c(5, 4, 5)),
  data = lapply(1:14, function(x) {
    # just making some data
    n_points <- sample(c(2:5), size = 1)
    ages <- sort(sample(c(10:24), size = n_points))
    data.frame(age = ages, score = rbeta(n_points, 1, 4))
  })
) %>%
  tidyr::unnest(data)

ggplot(data, aes(x = age, y = score)) +
  geom_point() +
  geom_line(aes(color = group)) +
  facet_wrap("id", ncol = 5)
center
We would like to have one row per group. So we actually would want four panels on the middle row. If we add an extra panel to fill that space and then remove it, we can achieve this goal.
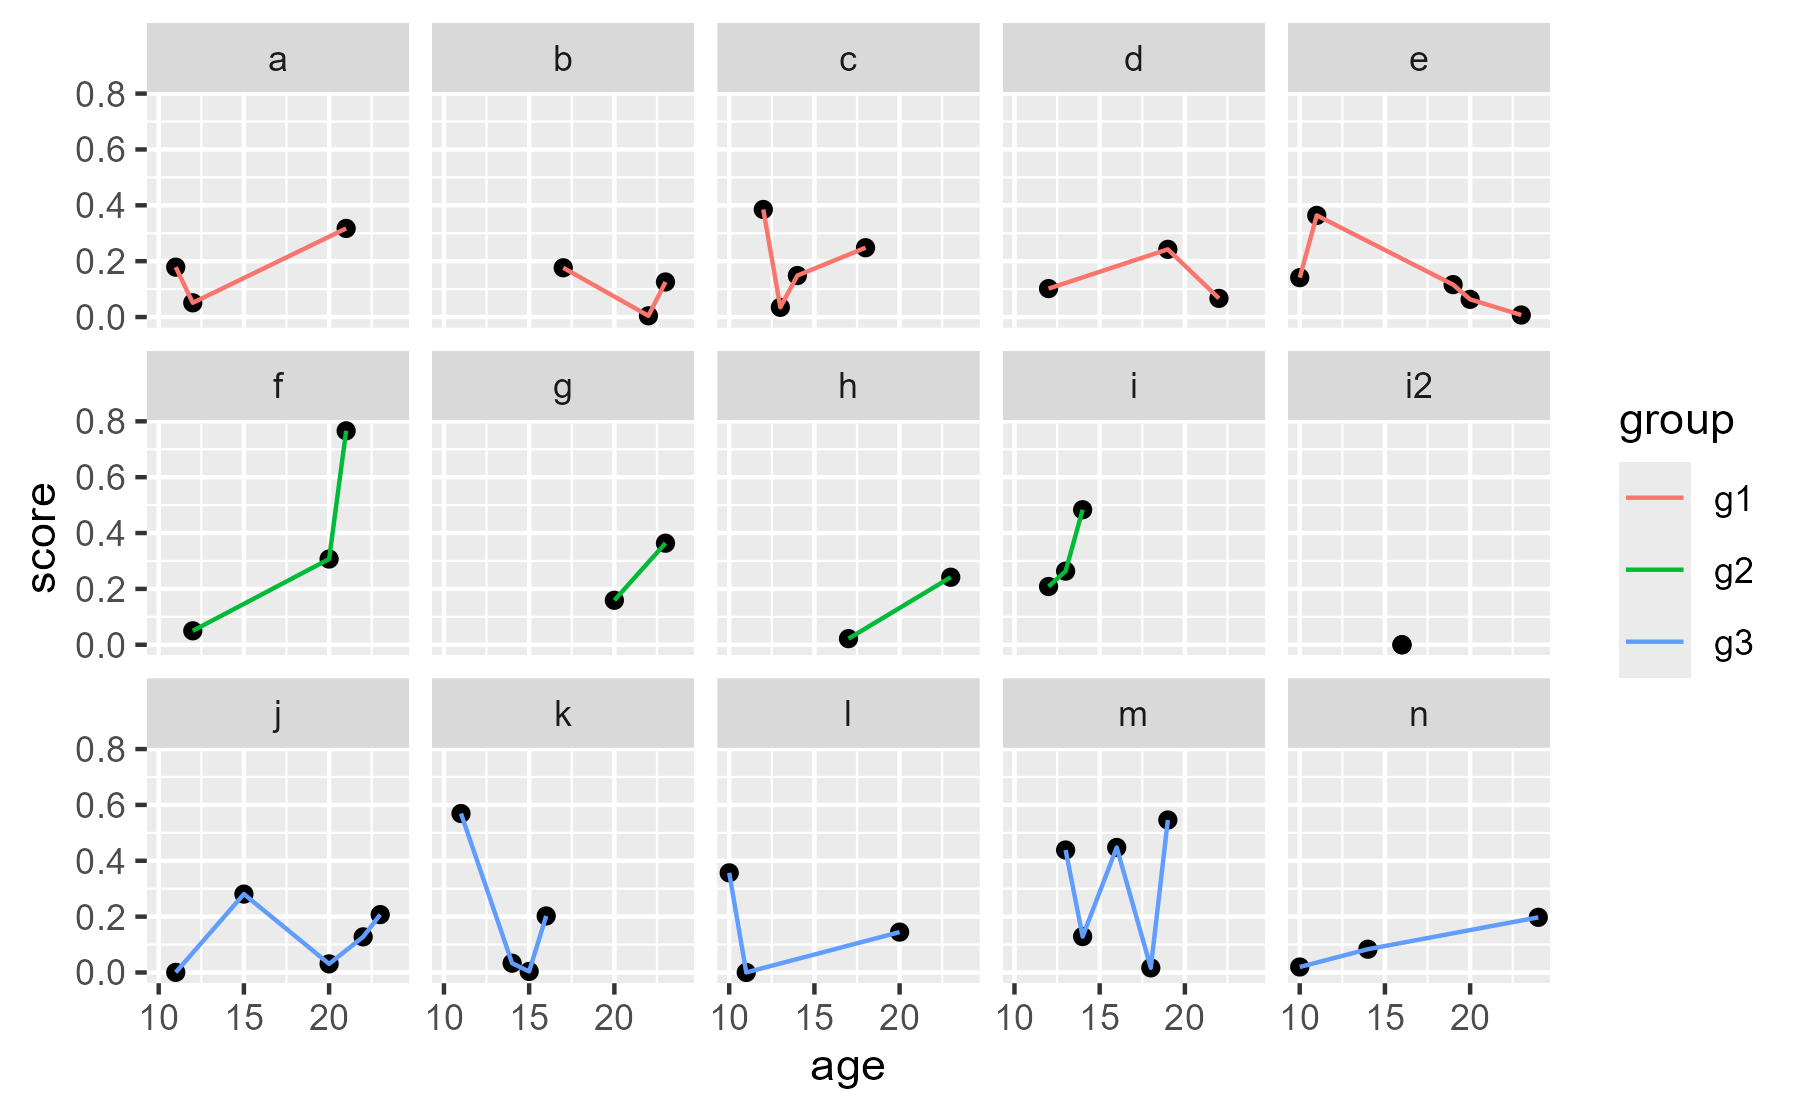
First add the dummy panel.
data <- data %>%
  tibble::add_row(id = "i2", group = "g2", age = median(data$age), score = 0) %>%
  # two points so that geom_line() doesn't warn
  tibble::add_row(id = "i2", group = "g2", age = median(data$age), score = 0)

ggplot(data, aes(x = age, y = score)) +
  geom_point(na.rm = TRUE) +
  geom_line(aes(color = group), na.rm = TRUE) +
  facet_wrap("id", ncol = 5)
center
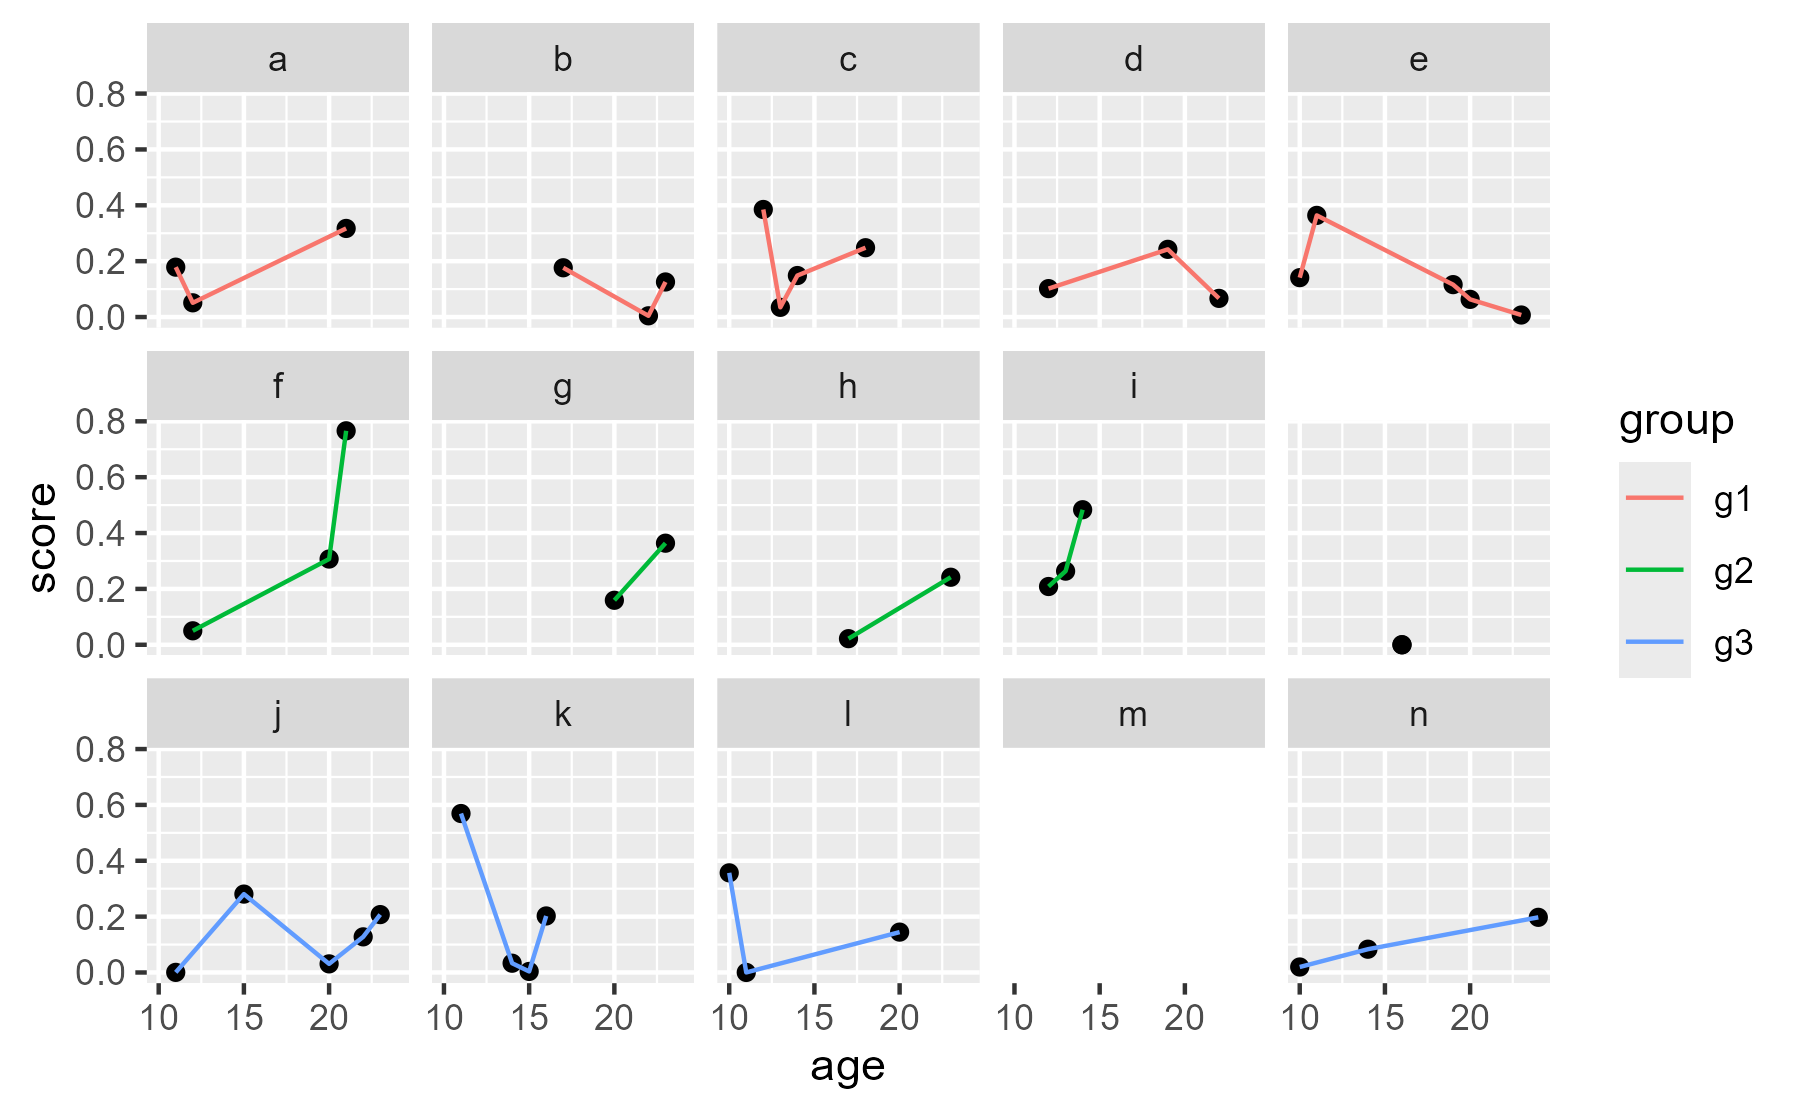
2026 note: This broke over time. My overly complicated approach
was to manually delete the grob using the following. Finding the
pattern name is very tedious because you basically have to guess the
strip and panel numbers.
p <- last_plot()
g <- ggplotGrob(p)
# guess and check
pattern <- "panel-4-3|strip-t-5-2"
to_drop <- str_which(g$layout$name, pattern)
to_keep_names <- str_subset(g$layout$name, pattern, negate = TRUE)
# delete grob data, clean up layout table
g$grobs[to_drop] <- NULL
g$layout <- g$layout[g$layout$name %in% to_keep_names, ]
grid::grid.newpage()
grid::grid.draw(g)
center
Although I am going to give better solution, I did write this entry precisely to have this code here for my reference.
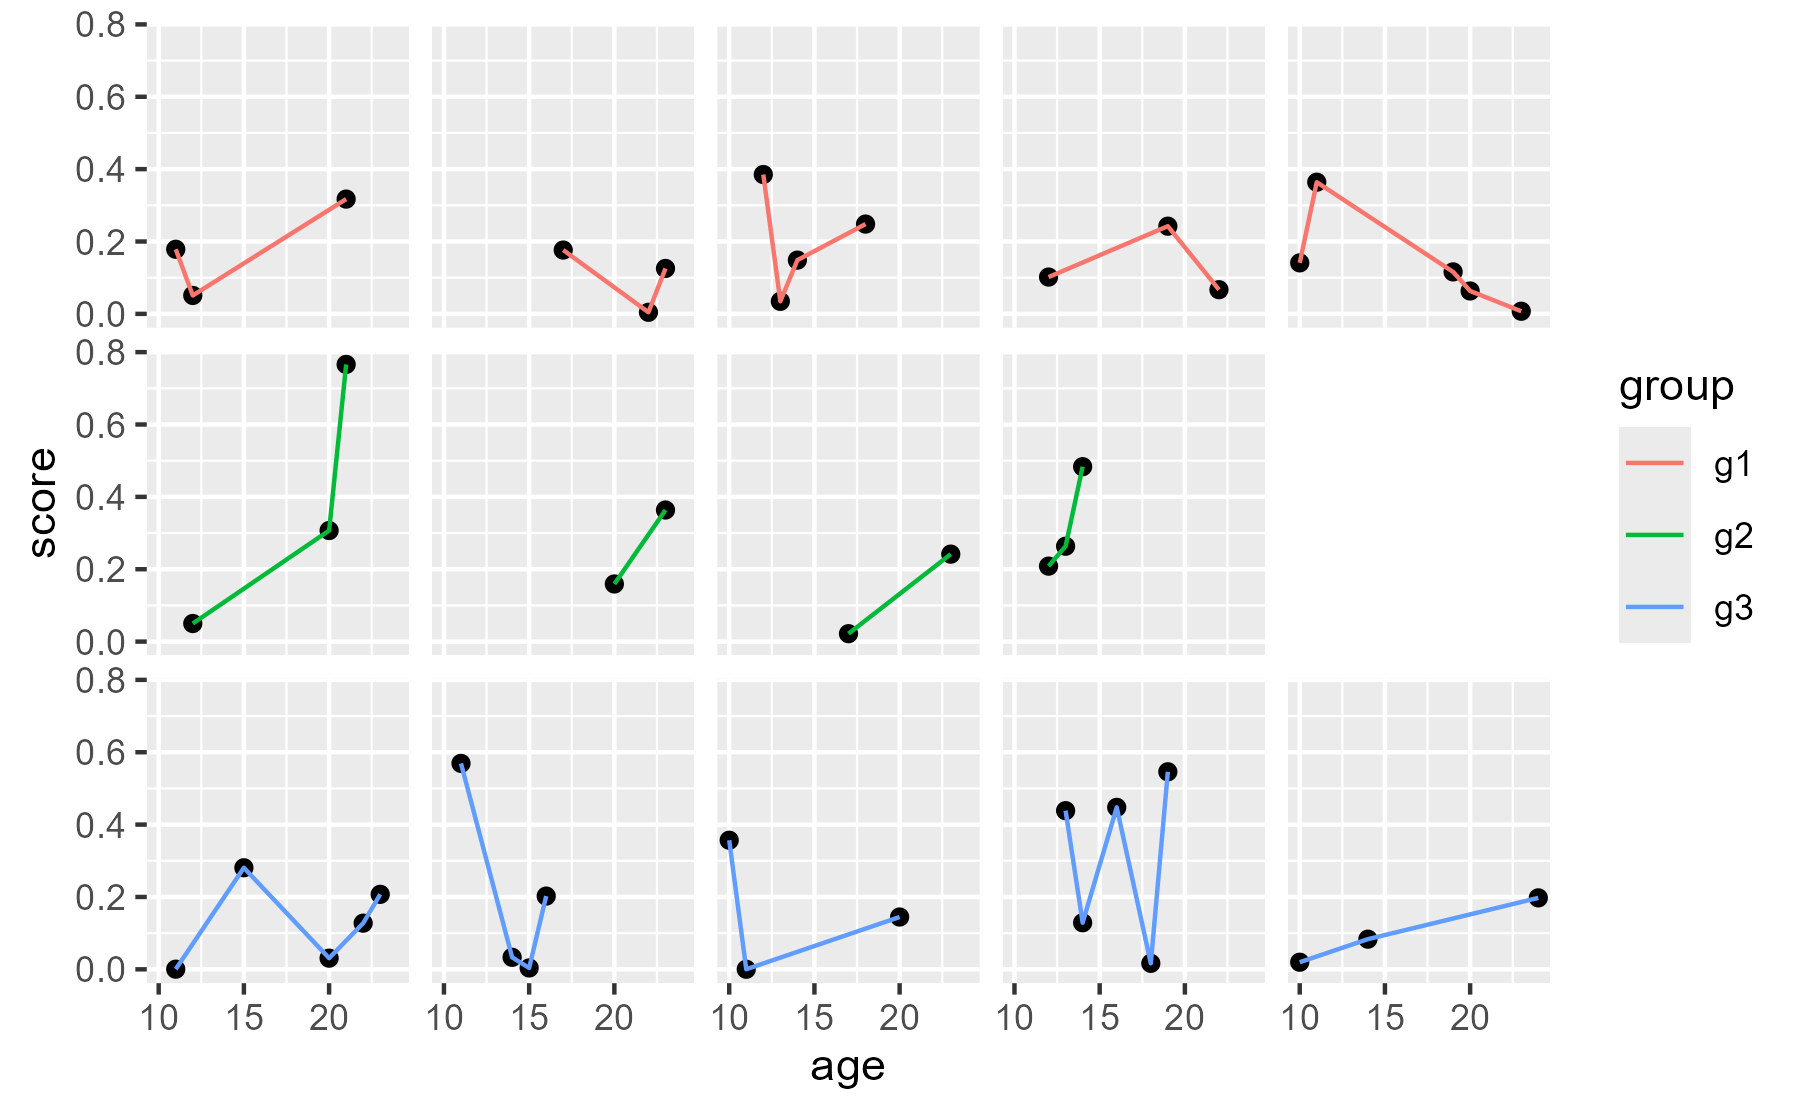
A better approach is to blank the cell with a ribbon. We have to eliminate strip titles from the theme for this approach to work.
ggplot(data, aes(x = age, y = score)) +
  geom_point(na.rm = TRUE) +
  geom_line(aes(color = group), na.rm = TRUE) +
  geom_ribbon(
    aes(ymin = -Inf, ymax = Inf),
    data = tibble(
      id = "i2",
      age = c(-Inf, Inf),
      group = "g2",
      score = NA_real_
    ),
    fill = "white",
    color = "white"
  ) +
  facet_wrap("id", ncol = 5) +
  theme(strip.text.x = element_blank())
center
Brenton on
Twitter
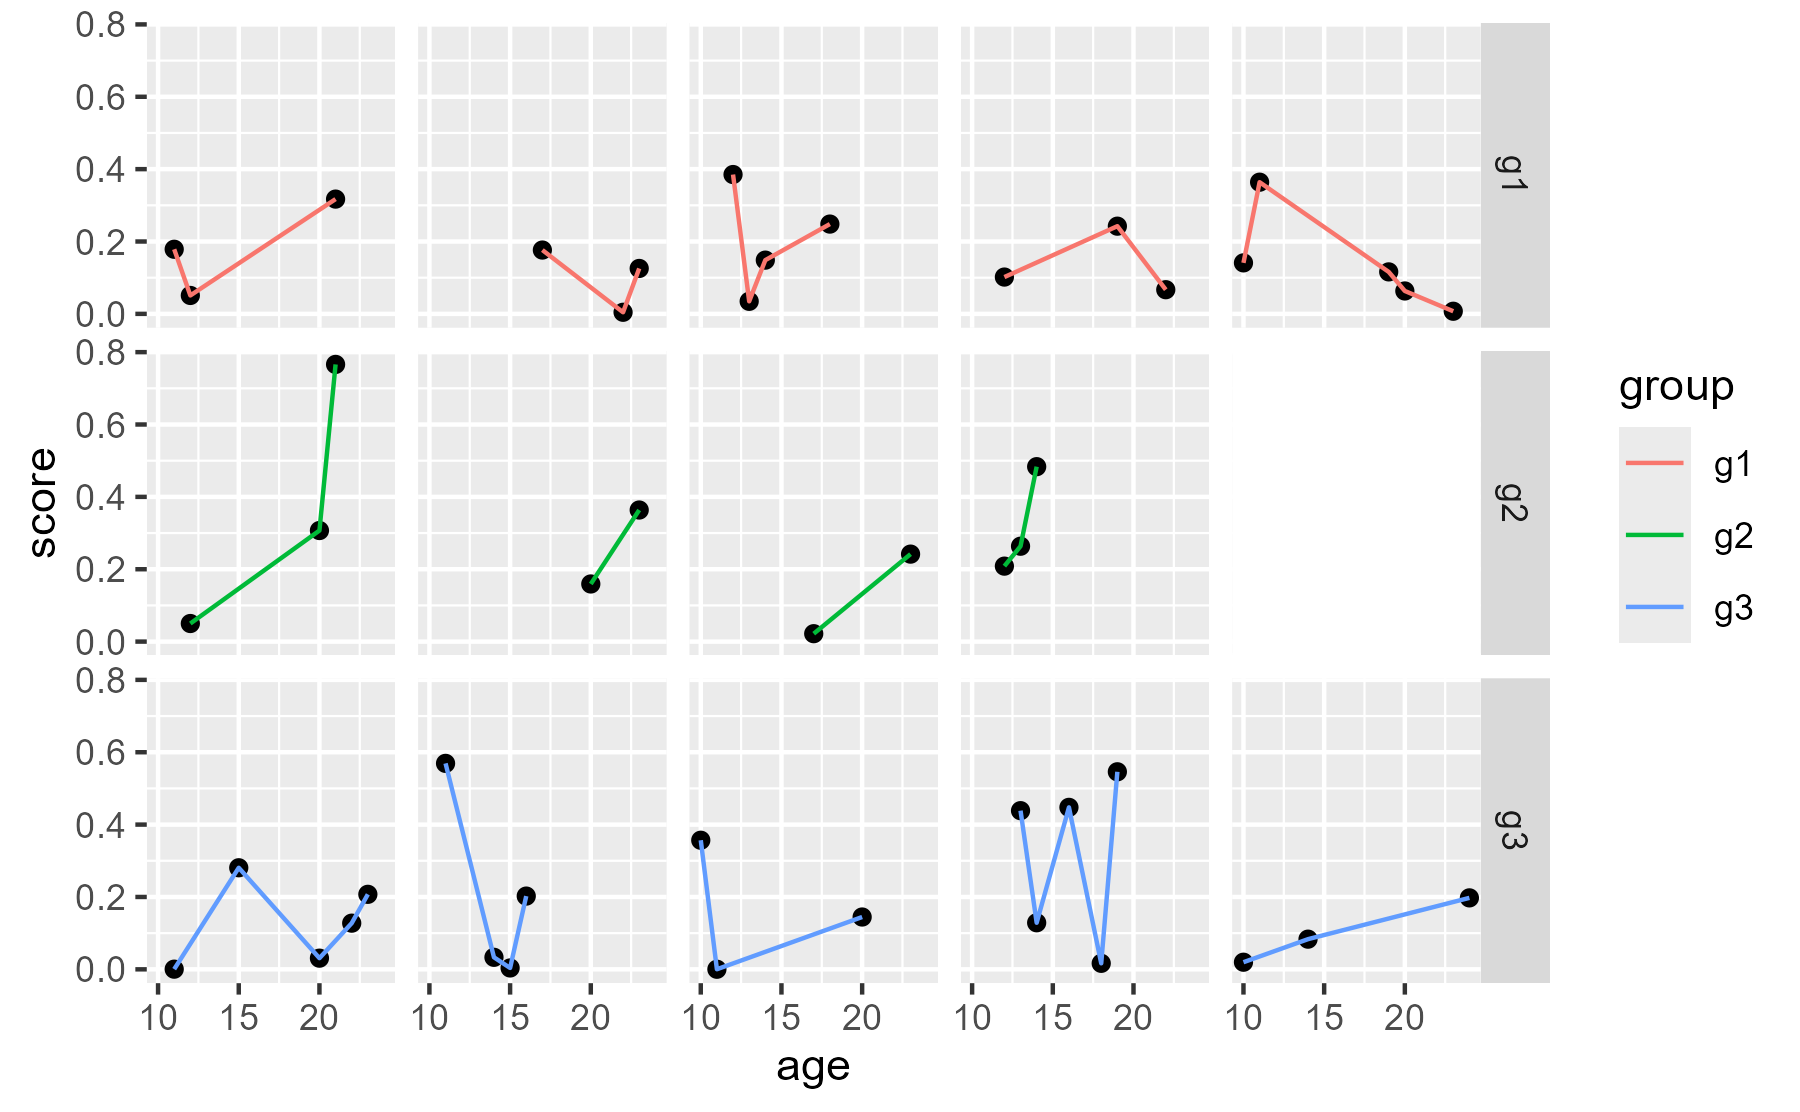
suggested numbering IDs within groups and using facet_grid(). That
works, and it also can give labeled rows.
data <- data %>%
  group_by(group) %>%
  mutate(col_num = match(id, unique(id))) %>%
  ungroup()

ggplot(data, aes(x = age, y = score)) +
  geom_point(na.rm = TRUE) +
  geom_line(aes(color = group), na.rm = TRUE) +
  geom_ribbon(
    aes(ymin = -Inf, ymax = Inf),
    data = tibble(
      col_num = 5,
      age = c(-Inf, Inf),
      group = "g2",
      score = NA_real_
    ),
    fill = "white",
    color = "white"
  ) +
  facet_grid(group ~ col_num) +
  theme(strip.text.x = element_blank())
center
Leave a comment