Controlling geom_lineribbon() legend order and aesthetics
[This note dates back to 2019 but I’ve updated it to run with ggplot2 4.0.0 in 2026.]
library(tidyverse)
library(ggdist)

model <- rstanarm::stan_glm(Sepal.Length ~ Sepal.Width, gaussian(), iris)
colors <- colorspace::sequential_hcl(5, palette = "Purples")
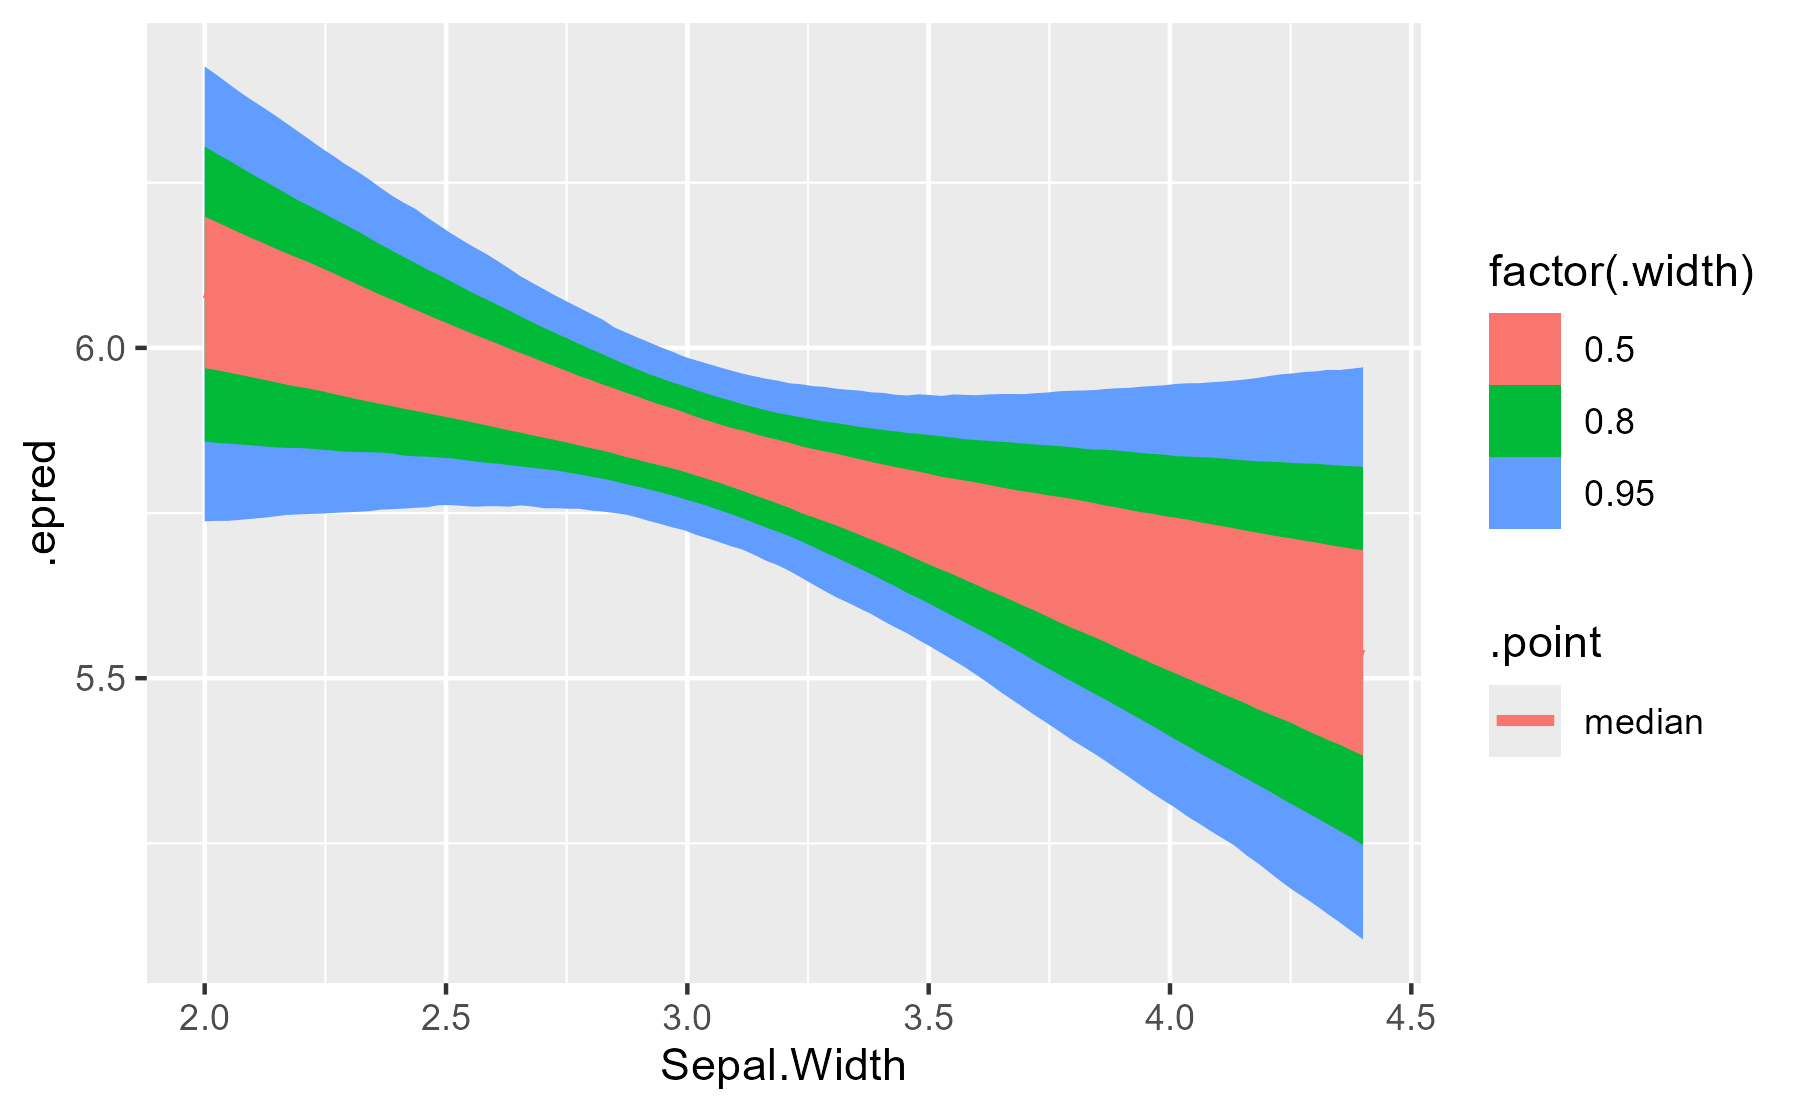
Here is the basic lineribbon output but we mapped the type of point estimate to the color of the line.
data_stats <- iris |>
  tidyr::expand(
    Sepal.Width = seq(min(Sepal.Width), max(Sepal.Width), length.out = 100)
  ) |>
  tidybayes::add_epred_draws(model) |>
  ggdist::median_qi(.width = c(.95, .8, .5))

ggplot(data_stats) +
  aes(x = Sepal.Width, y = .epred) +
  ggdist::geom_lineribbon(
    aes(fill = factor(.width), color = .point, ymin = .lower, ymax = .upper)
  )
center
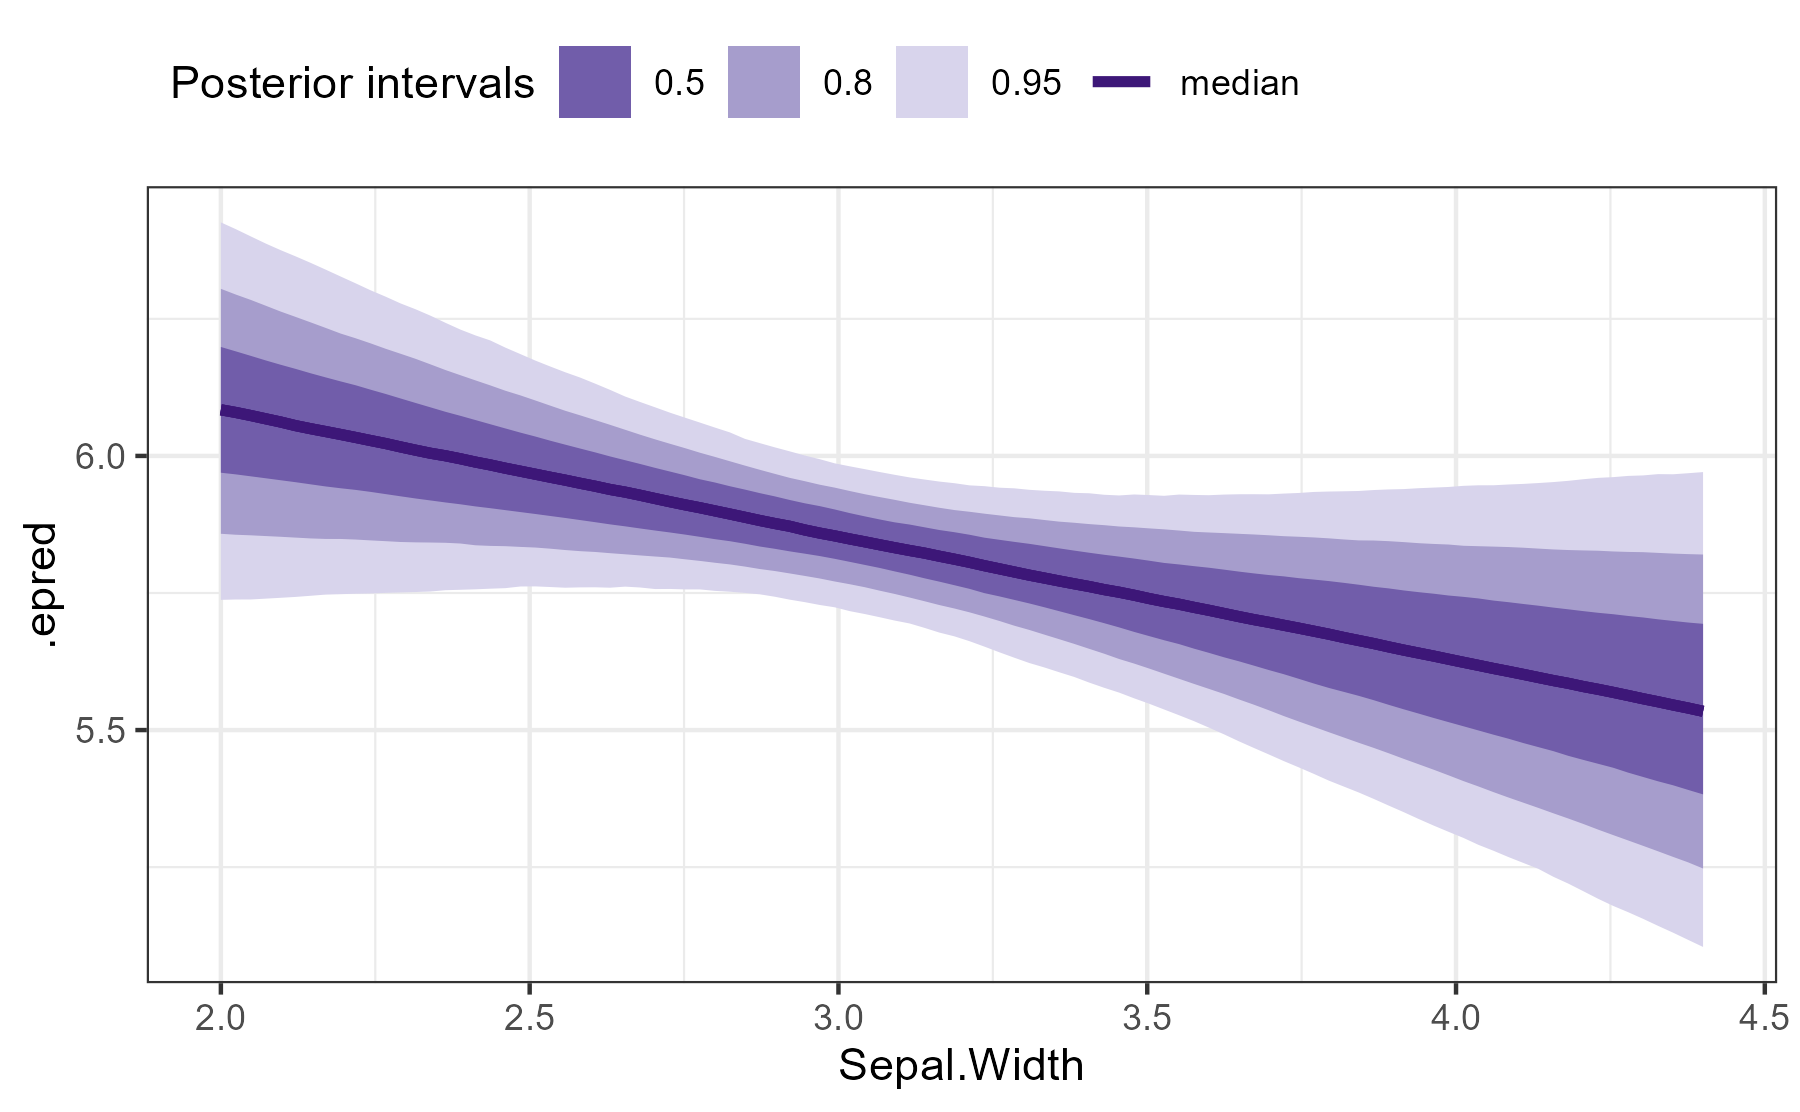
We can integrate the legend and tweak the legend to make the output nicer. We have to set the fill for the last square, and I use the RBG+alpha format to make it transparent.
ggplot(data_stats) +
  aes(x = Sepal.Width, y = .epred) +
  ggdist::geom_lineribbon(
    aes(fill = factor(.width), color = .point, ymin = .lower, ymax = .upper),
  )  +
  scale_color_manual(
    aesthetics = c("fill", "color"),
    breaks = c("0.5", "0.8", "0.95", "median"),
    values = c(colors[2:4], colors[1])
  ) +
  guides(
    fill = guide_legend(
      title = "Posterior intervals",
      override.aes = list(
        fill = c(colors[2:4], "#FFFFFFFF")
      )
    ),
    color =  guide_legend(title = "Posterior intervals")
  ) +
  theme_bw() +
  theme(legend.position = "top", legend.justification = "left")
center
Leave a comment