Gompertz functions and parameterization
The Gompertz function “describes growth as being slowest at the start and end of a given time period. The right-side or future value asymptote of the function is approached much more gradually by the curve than the left-side or lower valued asymptote.”
\[f(t) = a\mathrm{e}^{-b\mathrm{e}^{-ct}} \\ a: \textrm{asymptote} \\ b: \textrm{translation left or right} \\ c: \textrm{growth factor} \\\]So we have two different growth rates but a single parameter relating to
growth rate. R’s implementation (stats::SSgompertz()) “simplifies” the
double exponential into Asym * exp(-b2 * b3 ^ x).
The scaling factor c or b3 makes sense in the original Gompertz equation. I couldn’t understand what the R version was doing because it was changing the base of exponentiation.
library(tidyverse)
#> Warning: package 'tibble' was built under R version 4.5.2
#> Warning: package 'tidyr' was built under R version 4.5.2
#> Warning: package 'readr' was built under R version 4.5.2
#> Warning: package 'purrr' was built under R version 4.5.2
#> Warning: package 'dplyr' was built under R version 4.5.2
#> Warning: package 'stringr' was built under R version 4.5.2
#> Warning: package 'lubridate' was built under R version 4.5.2
#> ── Attaching core tidyverse packages ──────────────────────── tidyverse 2.0.0 ──
#> ✔ dplyr     1.2.0     ✔ readr     2.2.0
#> ✔ forcats   1.0.1     ✔ stringr   1.6.0
#> ✔ ggplot2   4.0.2     ✔ tibble    3.3.1
#> ✔ lubridate 1.9.5     ✔ tidyr     1.3.2
#> ✔ purrr     1.2.1
#> ── Conflicts ────────────────────────────────────────── tidyverse_conflicts() ──
#> ✖ dplyr::filter() masks stats::filter()
#> ✖ dplyr::lag()    masks stats::lag()
#> ℹ Use the conflicted package (<http://conflicted.r-lib.org/>) to force all conflicts to become errors

gompertz <- function(xs, asym, b2, b3) {
  asym * exp(-b2 * exp(-b3 * xs))
}

# Make a quick ggplot2 layer of the gompertz function
stat_gompertz <- function(focus, asym, b2, b3, ...) {
  # show what i typed, not the values
  b2 <- rlang::enexpr(b2)
  asym <- rlang::enexpr(asym)
  b3 <- rlang::enexpr(b3)
  labs <- list(
    asym = rlang::expr_deparse(asym),
    b2 = rlang::expr_deparse(b2),
    b3 = rlang::expr_deparse(b3)
  )
  rlang::dots_list(asym, b2, b3, .named = TRUE)
  color <- sprintf("%s = %s", focus, labs[[focus]])
  stat_function(
    aes(color = color),
    fun = gompertz,
    args = rlang::inject(list(asym = !! asym, b2 = !! b2, b3 = !! b3)),
    ...
  )
}

ggplot() +
  xlim(-5, 5) +
  stat_gompertz("b3", 1, 1, 1) +
  stat_gompertz("b3", 1, 1, 0) +
  stat_gompertz("b3", 1, 1, .1) +
  stat_gompertz("b3", 1, 1, -.5) +
  ggtitle(
      expression(asym %*% exp(-b[2] %*% exp(-b[3] %*% x)))
  )
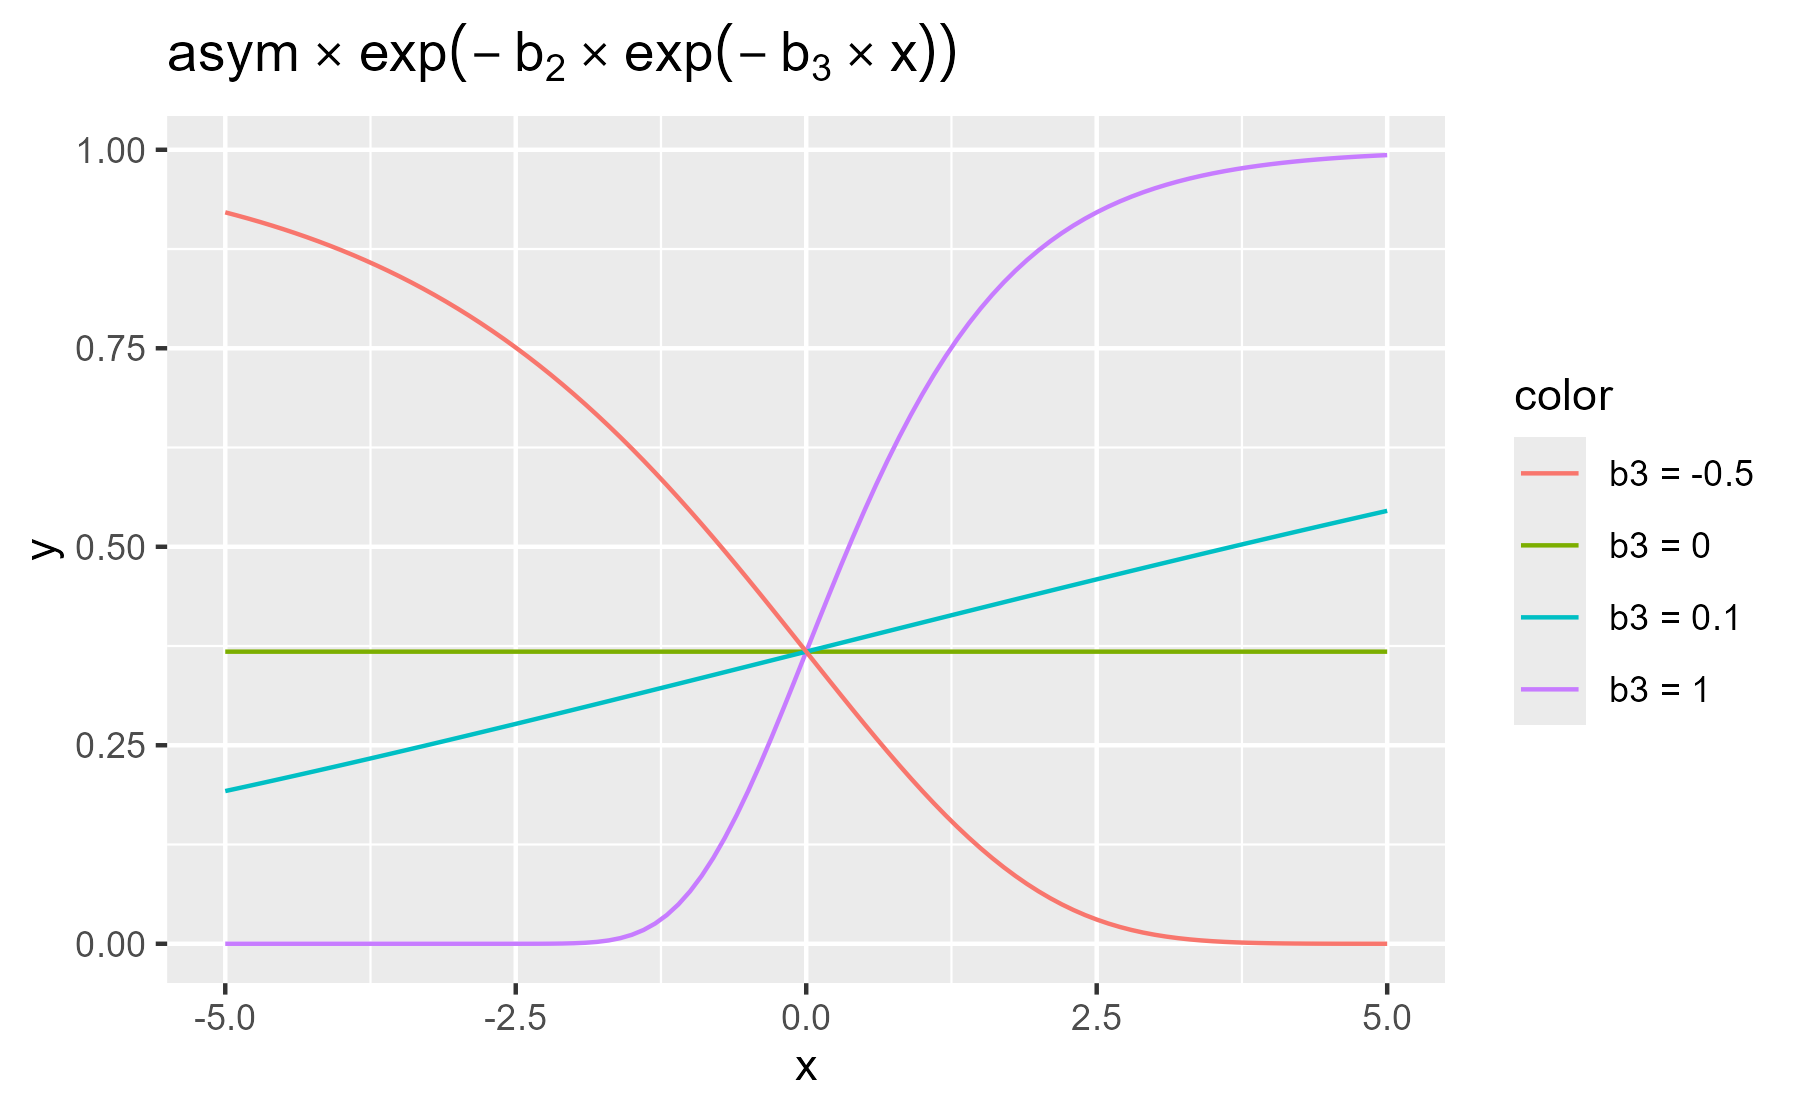
center
We have this weird feature where $b = 1/2$ and $b = 2$ are the same distance from $b = 1$, and the distance between the $b = 2, 3, 4$ gets smaller.
ggplot() +
  xlim(-5, 5) +
  stat_gompertz("b2", 1, 1/2, 1) +
  stat_gompertz("b2", 1, 2, 1) +
  stat_gompertz("b2", 1, 3, 1) +
  stat_gompertz("b2", 1, 4, 1) +
  stat_gompertz("b2", 1, 5, 1) +
  stat_gompertz("b2", 1, 1, 1) +
  ggtitle(
    expression(asymptote %*% exp(-b[2] %*% exp(-b[3] %*% x)))
  ) +
  labs(
    y = "gompertz(x)",
    color = expression(b[2]),
    subtitle = expression(paste(asymptote == 1, ", ", b[3] == 1))
  )
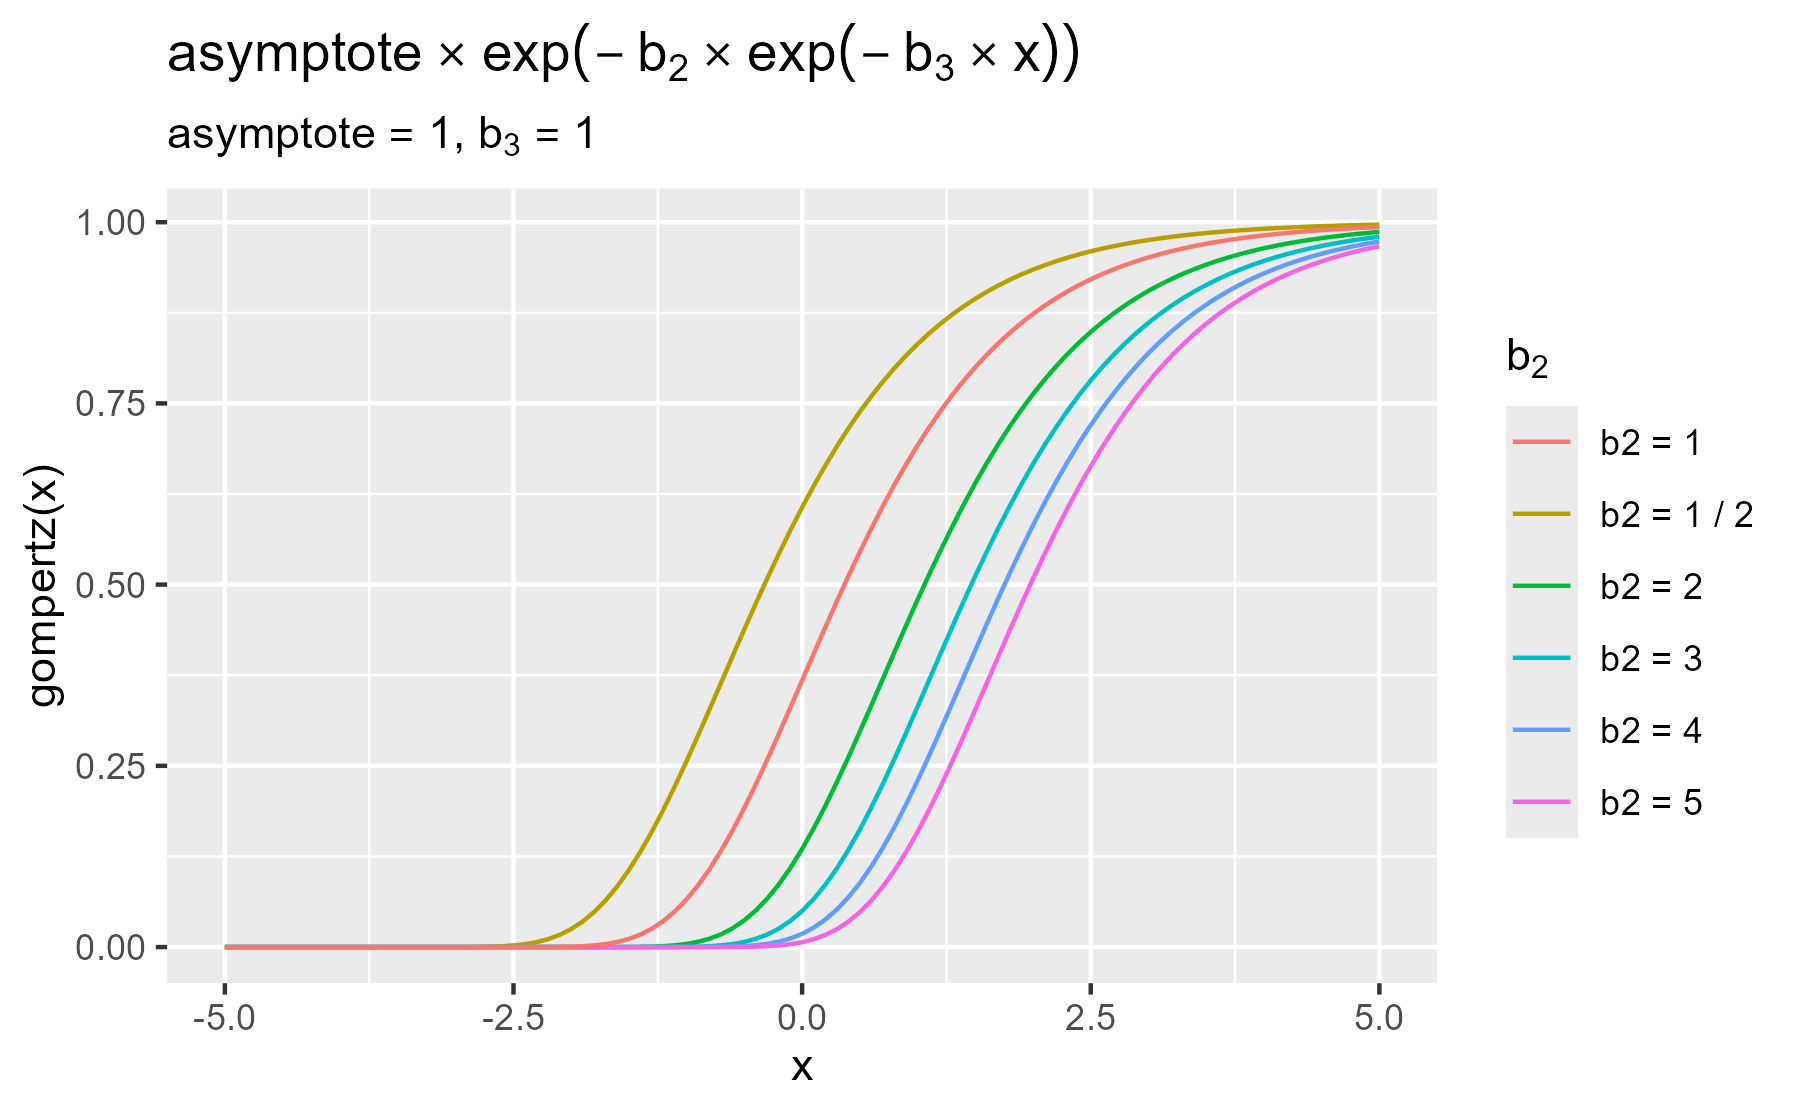
center
But the horizontal spacing of the lines is more regular when I
pass in exp() expressions.
ggplot() +
  xlim(-5, 5) +
  stat_gompertz("b2", 1, exp(-3), 1) +
  stat_gompertz("b2", 1, exp(-2), 1) +
  stat_gompertz("b2", 1, exp(-1), 1) +
  stat_gompertz("b2", 1, exp(0), 1) +
  stat_gompertz("b2", 1, exp(1), 1) +
  stat_gompertz("b2", 1, exp(2), 1) +
  stat_gompertz("b2", 1, exp(3), 1) +
  ggtitle(
    expression(asymptote %*% exp(-b[2] %*% exp(-b[3] %*% x)))
  ) +
  labs(
    y = "gompertz(x)",
    color = expression(b[2]),
    subtitle = expression(paste(asymptote == 1, ", ", b[3] == 1))
  )
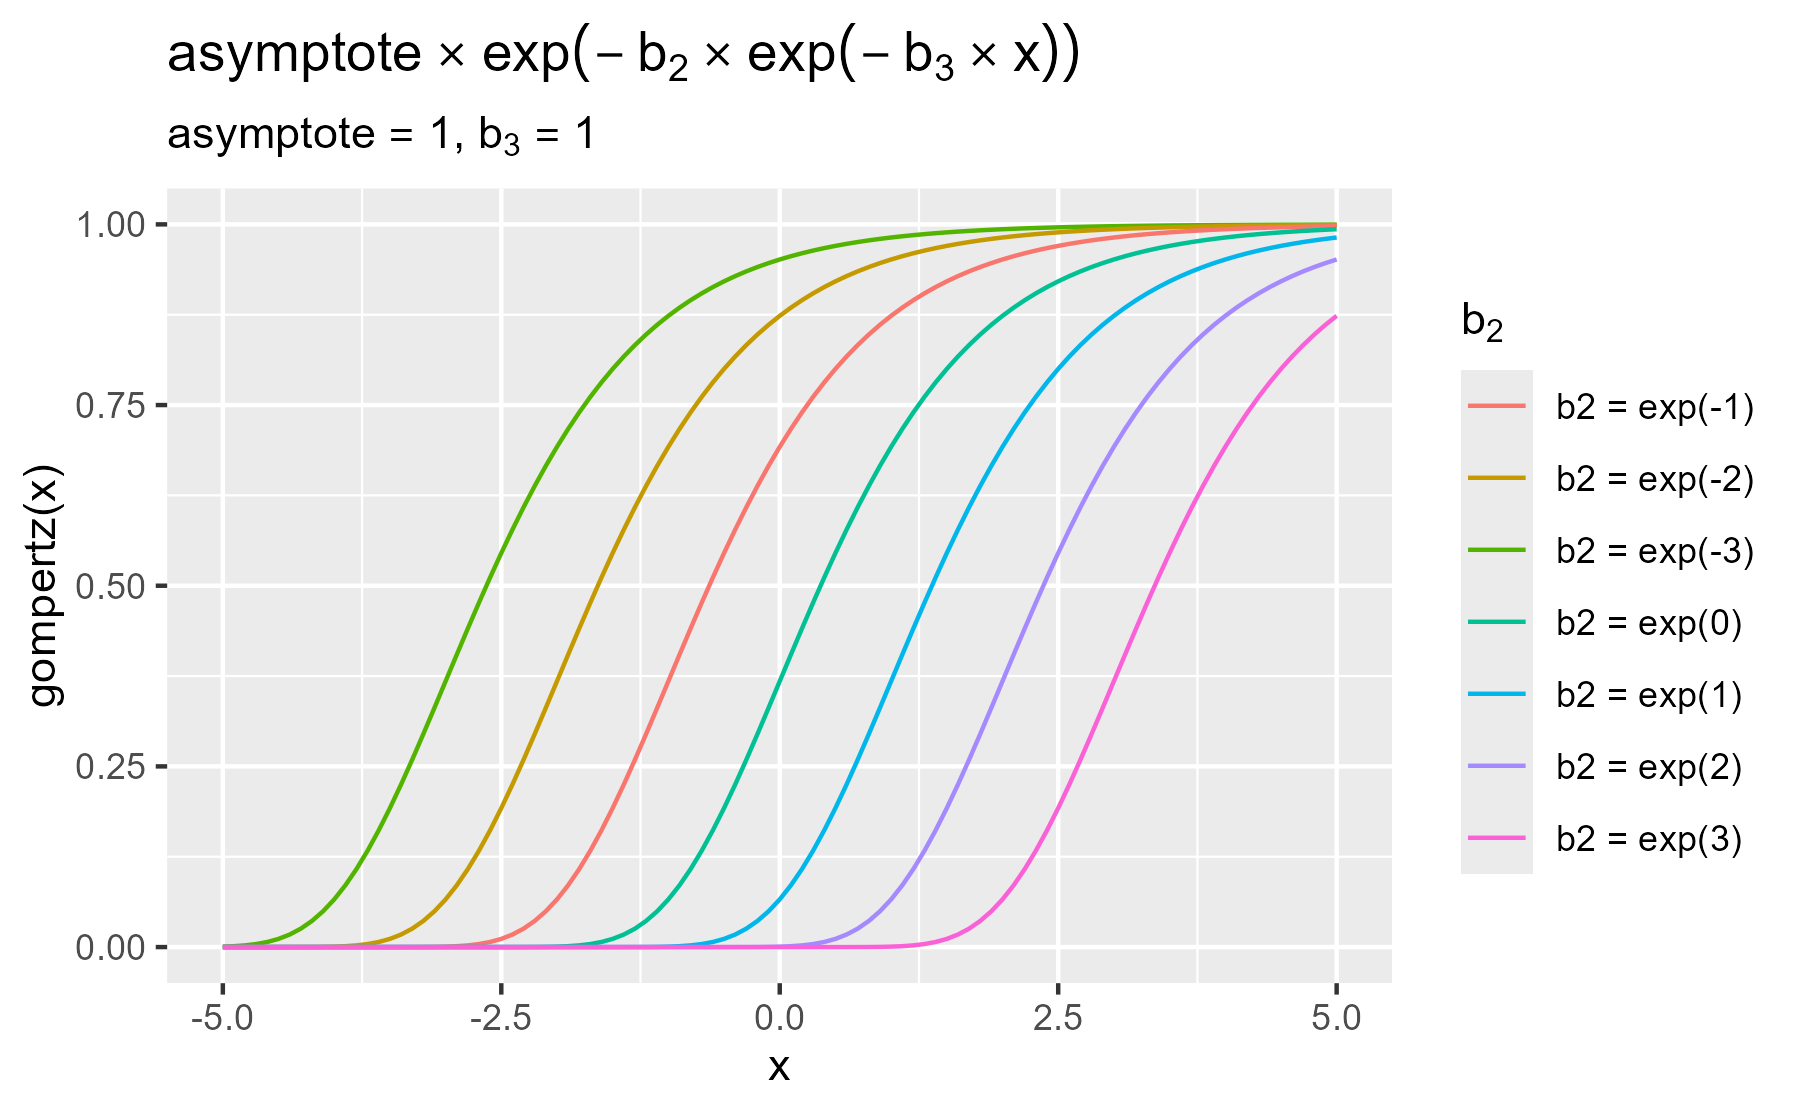
center
Suppose I want to set priors for intelligibility for this function. We want the age of steepest growth to be around age 4–5.
library(tidyverse)

gompertz <- function(xs, asym, b2, b3) {
  asym * exp(-b2 * exp(-b3 * xs))
}

set.seed(20230504)

asym <- 1
b2 <- rnorm(50, 5, 2)
b3 <- 1
gompertz_grid <- function(xs, asym, b2, b3, expand = TRUE) {
  if (expand) {
  d <- expand.grid(asym = asym, b2 = b2, b3 = b3) |>
    tibble::rowid_to_column(".draw")
  } else {
    d <- data.frame(asym = asym, b2 = b2, b3 = b3) |>
      tibble::rowid_to_column(".draw")
  }

  expand.grid(.draw = d$.draw, x = xs) |>
    dplyr::left_join(d, by = ".draw", relationship = "many-to-many") |>
    dplyr::mutate(
      y = gompertz(x, asym, b2, b3)
    )
}


xs <- 0:192
x <- (xs / 12)

d <- gompertz_grid(
  x,
  asym = plogis(rnorm(500, 0, 1.5)),
  b2 = rlnorm(500, 8, 1),
  b3 = rgamma(500, 2, 1),
  expand = FALSE
)

d_draw <- d |>
  distinct(.draw, asym, b2, b3) |>
  mutate(
    steepest_growth = log(b2) / b3,
    `log(b2)` = log(b2)
  ) |>
  select(-b2) |>
  tidyr::pivot_longer(-.draw)

library(patchwork)
ggplot(d) +
  aes(x = x, y = y) +
  geom_line(aes(group = .draw), alpha = .1) +
  xlim(0, 18)
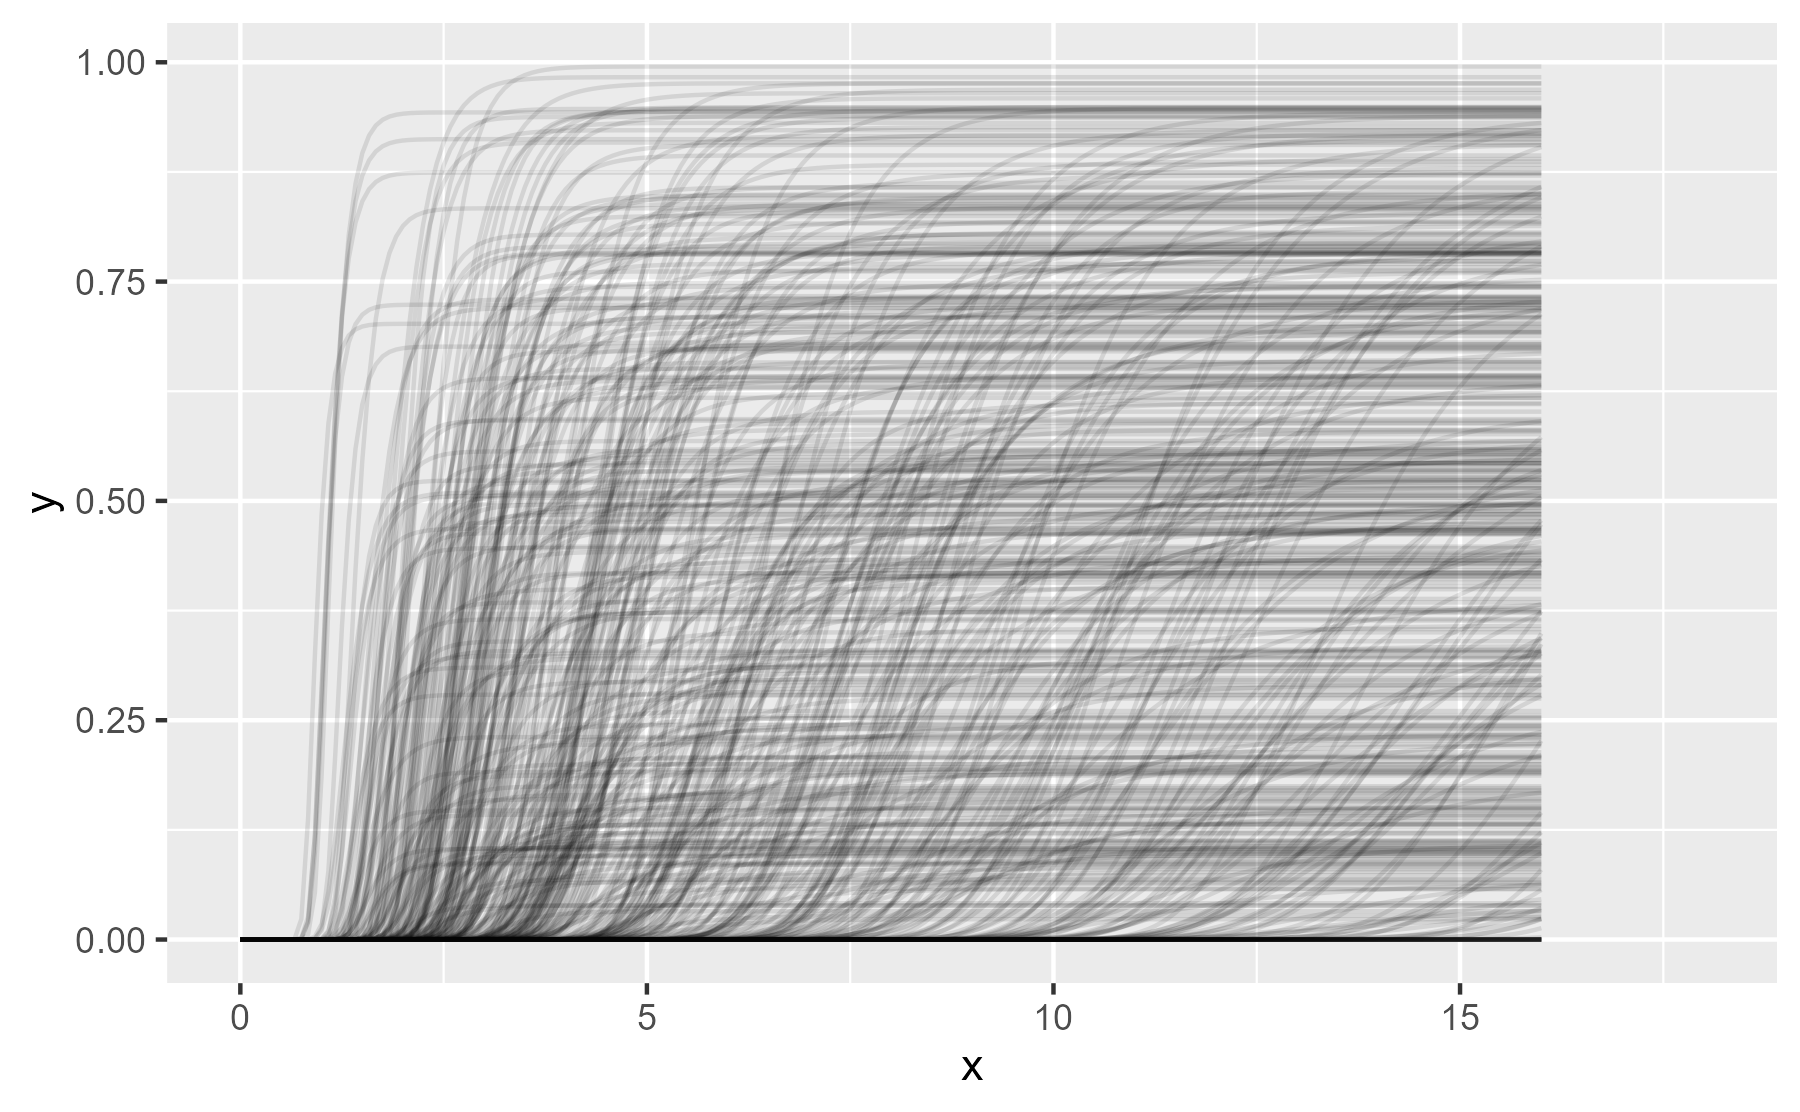
center
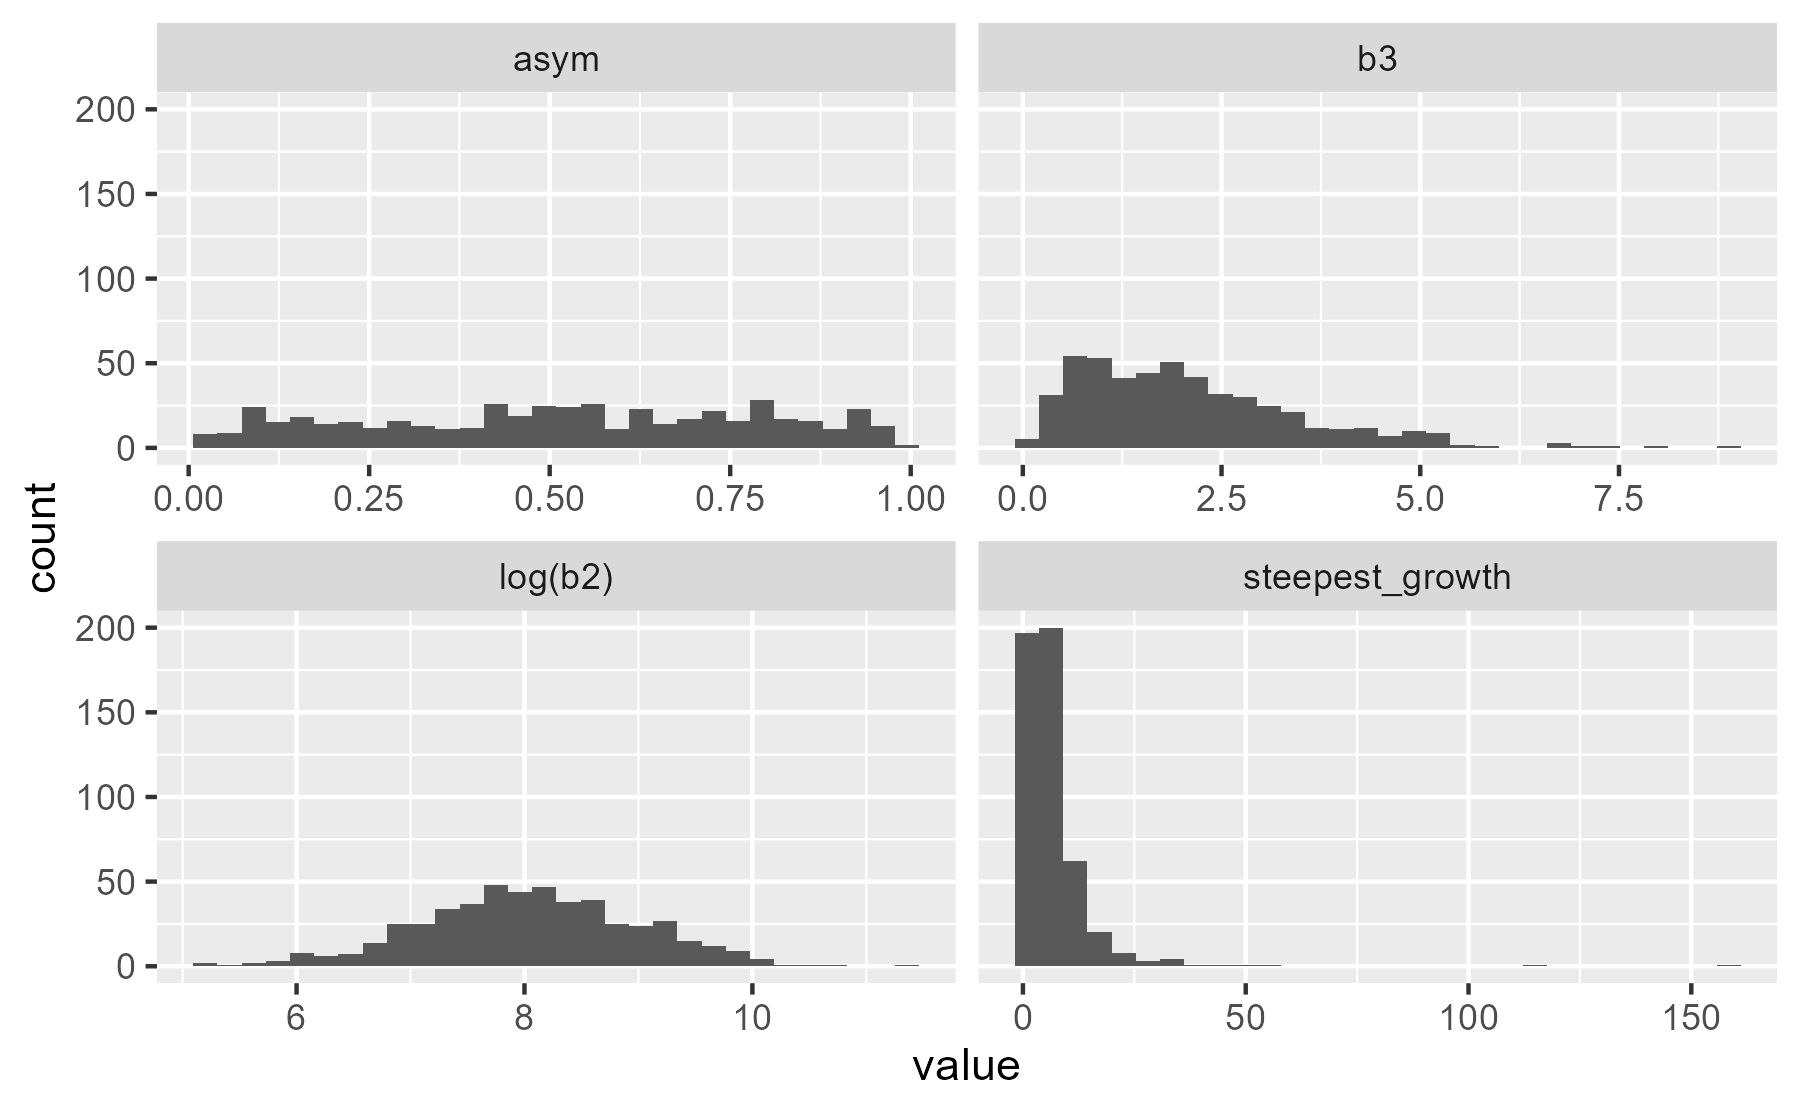
ggplot(d_draw) +
  aes(x = value) +
  geom_histogram() +
  facet_wrap("name", scales = "free_x")
#> `stat_bin()` using `bins = 30`. Pick better value `binwidth`.
center
b2 and b3 jointly determine the age of steepest growth, so I can’t put a simple prior on it.
Postscript from 2024. I never did use this function to model intelligibility.
Leave a comment