A Gaussian KDE is a sum of little Gaussians
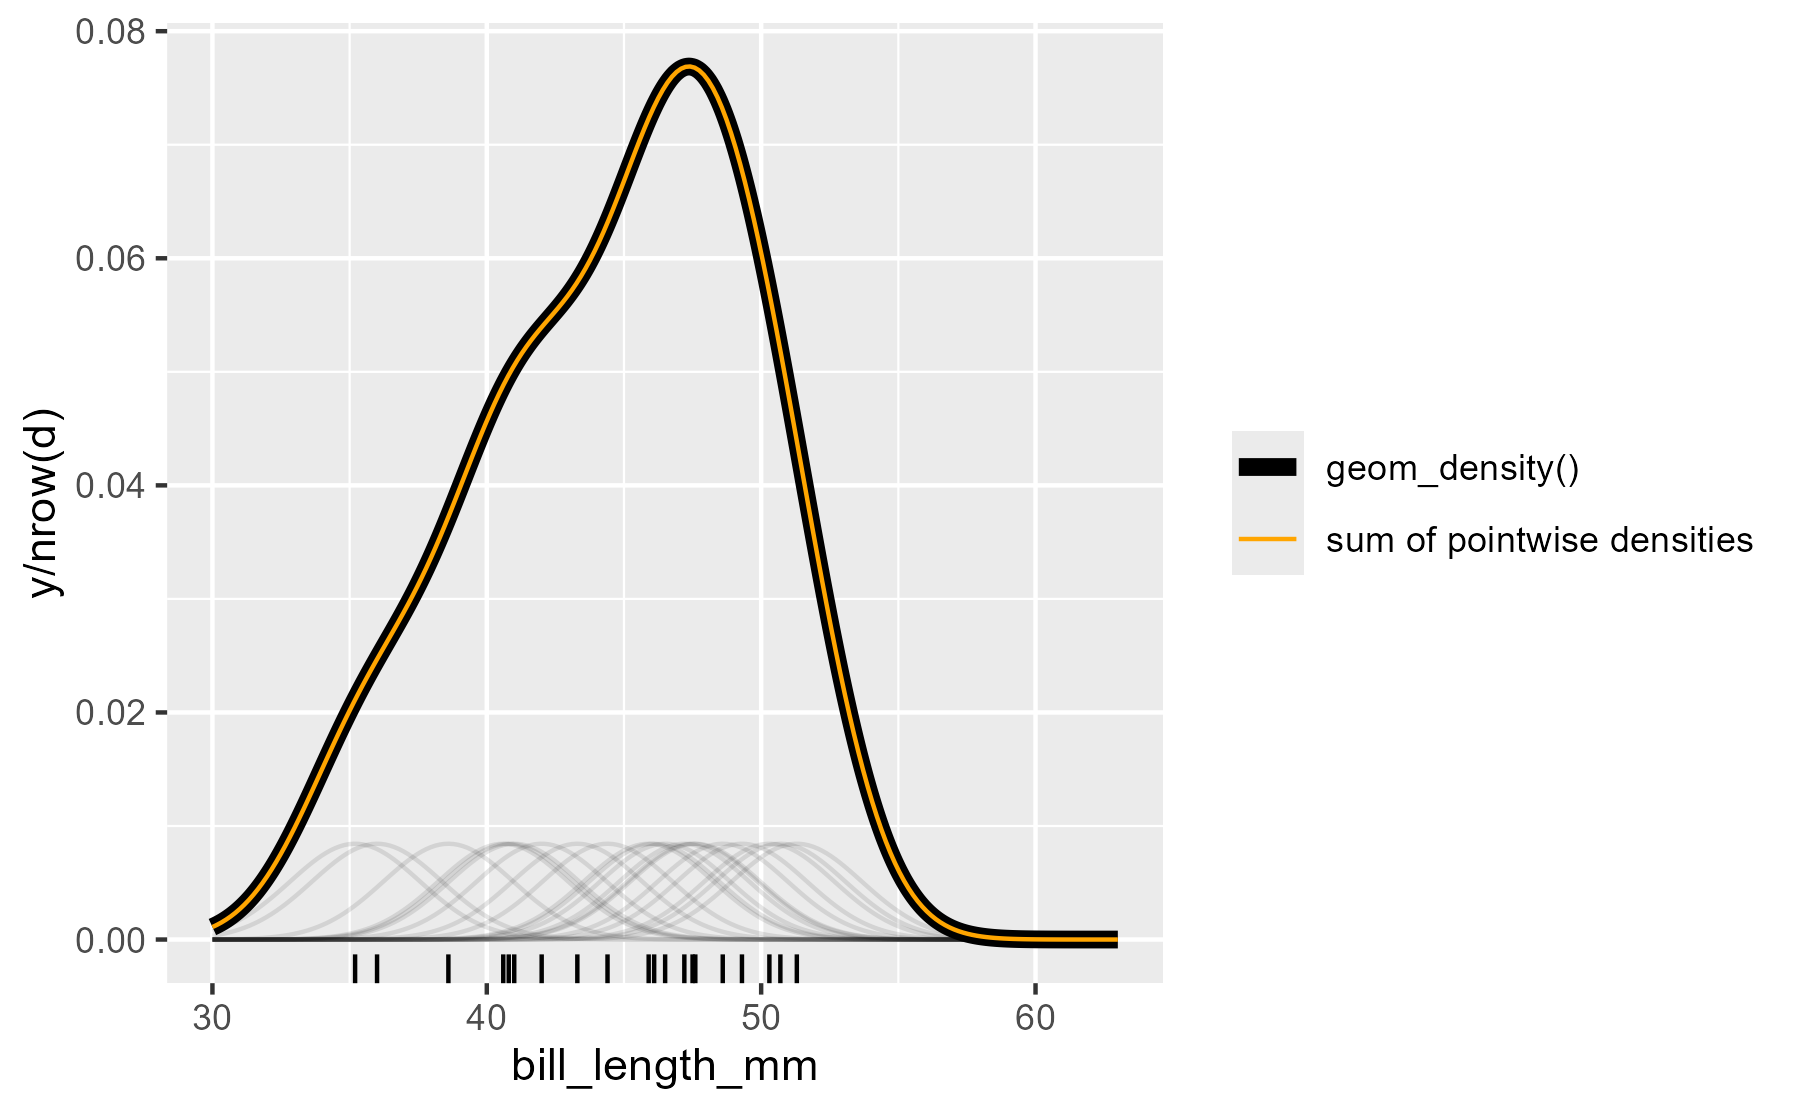
Today I learned from here that the Gaussian KDE is the sum of a bunch of little Gaussian curves. Here look:
library(tidyverse)
#> Warning: package 'tibble' was built under R version 4.5.2
#> Warning: package 'tidyr' was built under R version 4.5.2
#> Warning: package 'readr' was built under R version 4.5.2
#> Warning: package 'purrr' was built under R version 4.5.2
#> Warning: package 'dplyr' was built under R version 4.5.2
#> Warning: package 'stringr' was built under R version 4.5.2
#> Warning: package 'lubridate' was built under R version 4.5.2
#> ── Attaching core tidyverse packages ──────────────────────── tidyverse 2.0.0 ──
#> ✔ dplyr     1.2.0     ✔ readr     2.2.0
#> ✔ forcats   1.0.1     ✔ stringr   1.6.0
#> ✔ ggplot2   4.0.2     ✔ tibble    3.3.1
#> ✔ lubridate 1.9.5     ✔ tidyr     1.3.2
#> ✔ purrr     1.2.1
#> ── Conflicts ────────────────────────────────────────── tidyverse_conflicts() ──
#> ✖ dplyr::filter() masks stats::filter()
#> ✖ dplyr::lag()    masks stats::lag()
#> ℹ Use the conflicted package (<http://conflicted.r-lib.org/>) to force all conflicts to become errors
library(palmerpenguins)
#>
#> Attaching package: 'palmerpenguins'
#>
#> The following objects are masked from 'package:datasets':
#>
#>     penguins, penguins_raw

set.seed(20211122)
d <- penguins %>%
  filter(!is.na(bill_length_mm)) %>%
  sample_n(size = 20)

# grid of xs
x <- seq(30, 63, length.out = 200)

# compute density of xs using each observed value
# as the mean.
l <- lapply(
  d$bill_length_mm,
  function(m) {
    data.frame(
      x = x,
      y = dnorm(x, mean = m, sd = bw.nrd0(d$bill_length_mm))
    )
  }
)
dl <- bind_rows(l, .id = "obs")

# plot them, their sum, and the default density curve
ggplot(d) +
  aes(x = bill_length_mm) +
  geom_density(aes(color = "geom_density()"), size = 2, key_glyph = "path") +
  geom_rug() +
  geom_line(
    aes(x = x, y = y / nrow(d), group = obs),
    data = dl, alpha = .1
  ) +
  stat_summary(
    aes(x = x, y = y / nrow(d), color = "sum of pointwise densities"),
    data = dl,
    # alpha = .1,
    geom = "line",
    fun = "sum",
    # color = "orange"
  ) +
  scale_color_manual(values = c("black", "orange")) +
  labs(color = NULL)
#> Warning: Using `size` aesthetic for lines was deprecated in ggplot2 3.4.0.
#> ℹ Please use `linewidth` instead.
#> This warning is displayed once per session.
#> Call `lifecycle::last_lifecycle_warnings()` to see where this warning was
#> generated.
center
Leave a comment